Posts

Showing posts from December, 2023
Image
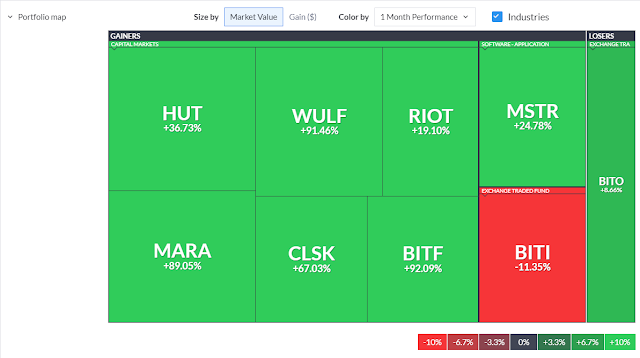
  Bitcoin-related Ticker Performance in 2023 Year and in December 2023 It has been a very strong performance year and month for bitcoin-related securities.   Treemap charts can be a very powerful data visualization tool.   This post is to show how treemap charts are well suited to conveying these kinds of results. Here is a one-month chart for December, 2023.   Despite some close price retreats towards the end of the month, bitcoin miner prices advanced well in December, 2023. BITF, the ticker for a Canadian-based miner which focuses on the use of hydro electricity sources, returned the largest monthly gain. MARA, a large, publicly traded company which focuses on US mining operations, returned the second largest monthly gain. Here is a year-to-date performance chart for the whole of 2023.   In the following chart, MARA with a gain of 578% edged slightly ahead of BITF with a gain of 555%. Other bitcoin miners returning over 300% for the year include RIOT and CLSK.   MSTR is
Image
How to Compare Close Prices for Three Securities Over Four Years This blog describes the relatively simple analytical task of comparing close prices for three securities from a start trading date through an end trading date in each of four years – namely, 2020, 2021, 2022, and 2023.  The close price data for successive trading days are derived from Yahoo Finance .  This post illustrates two main ways to compare close prices for different securities -- by performance charts within a year for each of the four years and by the compound annual growth rate (cagr) across the four years.  The three securities examined in this tip include Marathon Digital Holdings Inc. (MARA), the bitcoin-US dollar exchange rate (BTC-USD), and the SPDR S&P 500 ETF Trust (SPY). ·         The Marathon Digital Holdings site claims it is the largest bitcoin miner in North America as of November 30, 2023.  Bitcoin miners participate in verifying and maintaining the Bitcoin network.  Although the prices of b
Selected Prior References About Securities Trading Analytics Blog Topics from MSSQLTips.com The following table lists a selection of my articles on securities trading analytics.   These articles represent some of my best thoughts on securities analytics.   I will be issuing fresh posts that extend the scope of some these articles as well as covering new securities analytics topics.   You are invited to email me with any feedback about content in these articles as well as requests for new content that can help your securities trading or analytics research.   Indicator/Title Short Summary Relative Strength Index Indicator   Compute the Relative Strength Index for Time Series within SQL Server The Relative Strength Index (RSI) is widely used by technical analysts to detect the status of security prices as they reverse from oversold towards overbought and back again.   This article clearly explains and demonstrate
About the Security Trading Analytics Blog To empower site visitors who seek examples and demonstrations of quantitative methods for tracking and projecting security prices. Quantitative methods may include, but are not limited to: ·          Analysis of historical security prices ·          Technical analysis of trends and indicators ·          Models for when to buy and sell securities implemented with o    Python o    SQL Server o    Excel To present methods and resources that are practical and useful for individuals who want to become better traders and investors with the help of quant methods. About the Blog’s Author Hi, I am Rick Dobson, an analyst and a computer programmer who earned his Ph.D. at Arizona State University in psychology along with 12 hours of graduate-level computer science courses for one of my foreign language requirements.  I started my career as an Assistant Professor at Mary Washington College where I taught statistics, computer programming,