How to Compare Close Prices for Three Securities Over Four Years
This blog describes the relatively simple analytical task of
comparing close prices for three securities from a start trading date through
an end trading date in each of four years – namely, 2020, 2021, 2022, and 2023. The close price data for successive trading
days are derived from Yahoo Finance. This post illustrates two main ways to
compare close prices for different securities -- by performance charts within a
year for each of the four years and by the compound annual growth rate (cagr)
across the four years. The three
securities examined in this tip include Marathon Digital Holdings Inc. (MARA),
the bitcoin-US dollar exchange rate (BTC-USD), and the SPDR S&P 500 ETF
Trust (SPY).
· The Marathon Digital Holdings site claims it is
the largest bitcoin miner in North America as of November 30, 2023. Bitcoin miners participate in verifying and
maintaining the Bitcoin network.
Although the prices of bitcoins can change over time depending on supply
and demand, bitcoin use cases include online payments and investing based on
their storage of value. When a miner
discovers a previously unknown bitcoin, then a new bitcoin is created and added
to the Bitcoin network.
· The bitcoin-USD exchange rate depends on the
demand for bitcoins at any point in time.
The greater the demand for bitcoins, the higher the bitcoin-USD exchange
rate.
· The SPDR S&P 500 ETF Trust is an exchange
traded fund that tracks the S&P 500 stock index. This index represents leading securities in
the US Stock market. The underlying securities
in the exchange traded fund are re-balanced periodically by adding and dropping
securities to maintain its status as a fund that tracks leading US securities. The SPY ticker represents the capitalization
weighted average of security components in the S&P 500 index.
You can reuse the analytics design described in this post
for any set of securities as well as any timeframe.
How this post derives close prices for MARA, BTC-USD, and SPY
The Yahoo Finance site includes a
seven-step process for downloading historical data for a security (open,
high, low, close, and adjusted close prices as well as volumes exchanged for
each time frequency, such as a trading day, week, or month). The process depends on a Yahoo Finance
interface that is available for use without charge.
By designating the ticker symbol along with the start and end dates as well as selected other details, you can migrate data to the download folder of a user’s computer requesting historical data from Yahoo Finance. The downloaded file has the name of the ticker symbol in the request for historical data.
The close price is the price at the end of a
trading period. The adjusted close price
reflects corporate actions, such as splits and dividends, that convert closing
prices to adjusted close prices. Traders
are more likely to track close price over time and technical
analysis indicators based on close prices. Long-term investors
are more likely to track adjusted close price because it better reflects how an
initial investment changes value over an extended period, such as many years or
even decades. This post focuses on tracking
close prices over time.
Yahoo Finance returns a csv file in Unix format in response to
a request for historical data. Because
this post illustrates how to take advantage of Excel file features, the
downloaded files of historical data are saved as xlsx files before any other
processing.
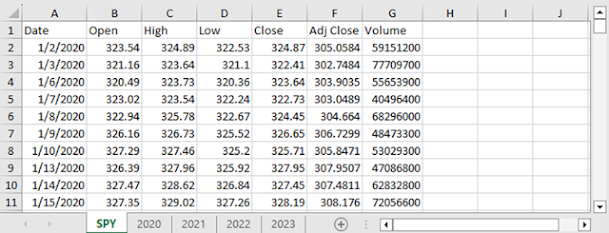
The following pair of screenshots show the first and last ten rows of historical data for the SPY ticker in an xlsx file. The trading dates appear in column A. The close price for each trading date appears in column E. The other items of historical data are not used in this post, but they are nevertheless downloaded automatically from Yahoo Finance.
If you review the entries in the date columns values, you can notice that not all calendar dates appear. For example, January 1 as well as January 4 and 5 are missing. This is because US stock markets are closed on weekends and selected holidays, such as January 1. In addition, the second screen image showing the last trading dates ends on December 15, 2023. This is the last date for which data was collected from Yahoo Finance for this post.

The layout for the xlsx file includes items that do not appear in a csv file. For example, notice that there are tab markers along the bottom of each screenshot. The tab names are, respectively: 2020, 2021, 2022, and 2023. This is to facilitate the storing of separate computations and charts for each of the four years tracked in this post.
The following screenshot displays an excerpt from the first 18 rows of the 2020 tab in the SPY.xlsx file. This tab contains only trading days belonging to 2020. Columns B through F are hidden because they are not required for the analysis in this post. Notice that an additional column (H) of data is added to the tab. This column reflects the value of the current close price relative to the first close price in a calendar year. This value reflects how the close price for the current trading date changes relative to the first trading date in a year. Additionally, a chart window appears with a title of “Performance from first trading day in 2020”; this text is also the column header for column H. The performance value for January 3, 2020 is .99; this value indicates the close price for the second trading day in 2020 is 1 percent below the close price for the first trading day in 2020. The performance value for December 31, 2020 rounds to 1.15. This value indicates that the close price on the last trading day in 2020 is 15 percent greater than the close price for the first trading day.

The tabs with names of 2021, 2022, and 2023 display performance values for the SPY ticker in each individual year.
Another xlsx file stores comparable data for the MARA
ticker. The file for the MARA ticker has
the same layout, but different values, than the file for the SPY ticker.
A third xlsx file stores generally comparable data as
reported by Yahoo Finance for the BTC-USD ticker. One significant difference between the
BTC-USD ticker and a security ticker, such as the MARA ticker or the SPY ticker,
is that bitcoins can be exchanged between buyers and sellers 24 hours a day and
7 days per week while tickers for stock exchange traded tickers can only be
exchanged during market trading hours. This
means that BTC-USD ticker open, high, low, close and volume data are available
for each calendar day. Yahoo Finance
does return an adjusted close column, but its values are always the same as the
close column. Bitcoins do not declare
dividends or have stock splits.
The following screen excerpt shows performance values for January 2 through January 17 in 2020. To the right of the table of performance values is a line chart across all dates in 2020. As you can see, the exchange of bitcoins does not stop for weekends or holidays. This means the BTC-USD time series data are for 365 days during non-leap years and 366 days for leap years. Also, the BTC-USD ticker has a final performance value of around 4.00 during 2020 while the SPY ticker has a final performance value of 1.15. In other words, the BTC-USD ticker grows much more during 2020 than the SPY ticker.

Performance Charts by Year for all three tickers
After you download and complete preliminary processing of
the historical data, many analysts will want to compare performance by
ticker. The following three screen
excerpts compare ticker performance.
Each excerpt is from a new Excel file that displays four charts per
tab. Each chart on a tab is for one of
the years for which data was tracked in the xlsx files from the preceding
section (2020, 2021, 2022, and 2023). As
you can see, there are four tabs in the file, but this section focuses on the
tabs with names of SPY Charts, MARA Charts, and BTC-USD Charts.
By comparing the charts within and between each tab, you can
discern patterns that may be helpful in analyzing the performance values for
the three tickers.
· The SPY ticker has performance values that vary
over a more limited range than either of the other two tickers. For trading applications that require lower
volatility, it may be more beneficial to focus on the SPY ticker as opposed to
either the MARA or BTC-USD tickers.
· Both SPY and BTC-USD show obvious performance
dips from around February through March in 2020. MARA also shows a performance dip around the
same time periods, but its dip is less evident than for the other two
tickers. All three dips reflect the
initial impact of the coronavirus pandemic on the performance of securities.
· After the reaction to the onset of the pandemic in 2020, performance values generally increased through the balance of 2020 and during most months in 2021. For example, SPY had an ending performance value of about 1.15 in 2020 followed by an ending performance value of 1.29 in 2021. MARA had ending performance values of about 10.00 and 3.00 in 2020 and 2021, respectively. BTC-USD achieved ending performance values of about 4.00 and 1.50, respectively, in 2020 and 2021.
· After the substantial performance gains through the end of 2020 and 2021, all three tickers showed downturns in performance values during 2022. There is another reversal from the downturn of 2022 to improving performance in 2023. Recall that results are only available through the middle of December 2023.


Comparing Security Growth with Compound Annual Growth Rate (CAGR)
CAGR is a simple way to compare the growth of two or more
securities over a timeframe. In order
for CAGR comparisons to be valid the timeframe (start date and end date) must
be the same for all comparisons. A CAGR
accurately reflects compounding whereas a simple percent change does not
reflect how a close price from the current year depends on the prior year
within a timeframe. Also, the CAGR
assumes no disbursements during the evaluation timeframe, but it does allow fractional
compounding periods.
With the data from this post, you can assess the CAGR with
the following expression:
(Ending value of a
security/Beginning value of a security)**(1/average annual number of years from
the beginning period through the ending period) -1
The preceding expression evaluates the CAGR as a decimal
value. Therefore, a return value of 1.00
from the preceding expression is equivalent to a 100% gain per year. Similarly, a return value of 0.10 corresponds
to a gain of 10% per year. For this
reason, some representations of the CAGR expression include multiplication by 100.
The following screen excerpt from the CAGRs tab below shows the inputs for computing the CAGR for each of the three tickers tracked in this post. The tickers appear in rows 3 through 5 of column A. The Beginning and Ending values display, respectively, for each ticker in columns B and C. The total number of trading days for each ticker appear in column D.
Securities such as those representing stocks or exchange traded funds are usually traded during normal trading hours on trading days for major stock exchanges; these hours start at 9:30 am and extend through 4:00 pm eastern time. In general, there are about 252 trading days per year in a trading year. As stated previously, bitcoins can be exchanged on any calendar day in a year. Ignoring leap-year exceptions, there are 365 days per calendar year. These values appear in column E of the following screen excerpt. As a result, rows 4 and 5 in column E show a value of 252, and row 3 in column E shows a value of 365.
· Column F for rows 3 through 5 contains the value in column D divided by the value in column E rounded to the nearest hundredth place. This is the average annual number of years for a ticker.
Finally, column G contains the numeric value of the CAGR for a ticker based on the values in the preceding columns. In the screenshot below, the cursor is resting in cell G3. The expression in the formula box has four parts
§
C3/B3 represents the Ending value divided by the
Beginning value.
§
^(1/F3) takes the quotient of C3/B3 to the 1/F3
power.
§
- 1 reduces the raised quotient value by 1.
§
*100 multiplies the reduced value by 100 to express
the CAGR value in percentage point units.

The CAGR values appear in column G. SPY has the smallest CAGR value (9.74). The next largest CAGR value (56.54) is for the bitcoin exchange rate in US dollars. The largest CAGR value (105.91) is for the MARA ticker. Recall that this ticker represents a leading miner of bitcoins within the US. Mining firms are rewarded with bitcoins by the Bitcoin network. In addition, mining firms typically retain a large portion of the bitcoins that they mine.
- Thus, mining firms have two main sources of income: (1) the cash equivalent of the reward for mined bitcoins and (2) the appreciation over time in the value of retained bitcoin rewards.
- By keeping the cost of mining operations below the rewards from mining and as long as bitcoins appreciate in the long run, it is reasonable to expect the value of a bitcoin miner to be greater than the exchange rate for bitcoins, which only reflects the current value of bitcoins.
Closing Points
Thanks for reading this post through to the end. I hope you found this post interesting. By comparing tickers as demonstrated in this
post, you can easily evaluate the performance of securities that you might be considering
for a watchlist. With such a watchlist,
you can have pre-screened tickers that are known to have good prior performance
when you think it is the right time to invest in a new ticker.
If you would like the files referenced in this tip, please
send a request to RickDobsonBlogs@gmail.com. I will reply with the files used to create
this blog back to your email address.
I am just starting to blog, and I welcome your suggestions about how to improve posts for you and the best ways to send files from future posts to you. Thank you very much for any feedback that you send to me.


Comments
Post a Comment