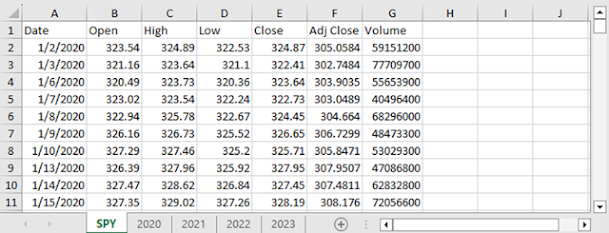
How to Compare Close Prices for Three Securities Over Four Years This blog describes the relatively simple analytical task of comparing close prices for three securities from a start trading date through an end trading date in each of four years – namely, 2020, 2021, 2022, and 2023. The close price data for successive trading days are derived from Yahoo Finance . This post illustrates two main ways to compare close prices for different securities -- by performance charts within a year for each of the four years and by the compound annual growth rate (cagr) across the four years. The three securities examined in this tip include Marathon Digital Holdings Inc. (MARA), the bitcoin-US dollar exchange rate (BTC-USD), and the SPDR S&P 500 ETF Trust (SPY). · The Marathon Digital Holdings site claims it is the largest bitcoin miner in North America as of November 30, 2023. Bitcoin miners participate in verifying and maintaining the Bitcoin network. Although the prices of b