GOOLEFINANCE Function in Google Sheets Can Download Historical Data via CSV Files
A recent prior post at this blog describes the disabling of a Yahoo Finance feature for downloading historical price and volume data into csv files. The Yahoo Finance web page from which you were formerly able to download historical prices without a fee has been updated by the following statement: "Downloading historical data is only available to Gold members." The disabled feature degrades Yahoo Finance as a supplier of free data for security trading analytic projects. As a result, this blog promised to investigate and demonstrate workarounds for the disabled free feature.
The Gold member subscription plan is currently priced at $49.95 per month or $479.40 per year when paid annually. While the Gold member plan includes additional benefits besides the download of csv files with historical data, these additional features do not support security trading analytics projects of historical security prices by self-directed investors. In evaluating a response to the price escalation from free to over $400 per year for historical data in csv files, I started to do some research on alternatives for those who still wanted the free download of historical data as csv files.
This post represents this blog’s first investigation of
alternatives for the previously free feature from Yahoo Finance. A major objective of the current post is to
equip you with examples of how to transfer historical prices via csv files from
Google Sheets.
You can populate a sheet in a Google Sheets file with
current and historical prices (as well as with other securities-related data) with
the help of the GOOGLEFINANCE function.
All you need to get started is a Google account, such as one for sending
and receiving emails via Gmail. There are
no fees associated with obtaining a Gmail account or with using the
GOOGLEFINANCE function in Google Sheets.
Here is an
overview article from Wikipedia on Google Sheets. Here are a couple of online tutorials for
Google Sheets (“Beginners
Google Sheets Tutorial” and “The Ultimate Beginner's
Guide To Google Sheets: Full Tutorial and Overview”).
The GOOGLEFINANCE function depends on the Google Finance
site, which does not depend on Yahoo Finance.
Consequently, you can download historical data from Google Finance even
when Yahoo Finance disables the download of historical price data via csv
files. After retrieving historical
prices for a financial security via the GOOGLEFINANCE function, you can then export
the retrieved data as a csv file for use in security trading analytics projects.
Obtaining Real-time Attribute Values for a Security
The GOOGLEFINANCE function can return attribute values for
many kinds of securities. Because the
returned attribute values reside in Google Sheets, you can also perform custom anlyses
with the returned attribute values. The
following screen shots highlight examples for what are typically referred to as
current or real-time attributes. Under
normal circumstances, real-time attributes values can be delayed by up to 20
minutes. Therefore, if you return
attribute values 20 minutes or more after the market closes for a trading day,
you can obtain the attribute value for the last trade within a day.
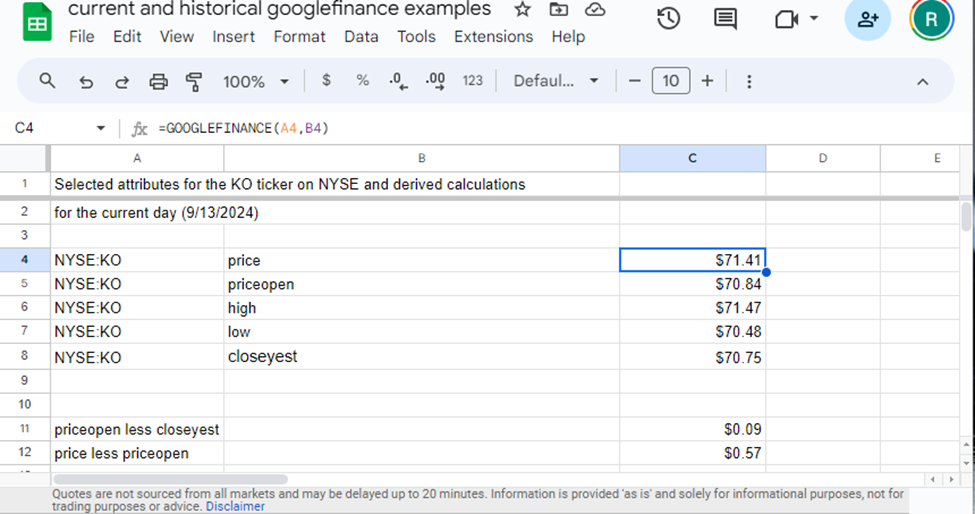
The following sheet excerpt lists five attributes in cells
B4 (price) through B8 (closeyest).
- The price attribute is an example of what GOOGLEFINANCE calls a real-time attribute
- If an attribute’s value is requested before the market closes plus the standard delay for an exchange, then GOOGLEFINANCE can return a value of up to 20 minutes past the current time.
- When the attribute’s value is requested 20 or more minutes after the market closes or on a holiday or a weekend day, then the function returns the current price through the end of the most recently completed trading day.
- Using the GOOGLEFINANCE function with the priceopen attribute returns the opening price for a trading day.
- The high attribute refers to the high price as of the current day for the day when the request is made. This means that the high attribute can vary throughout a day depending on when the request is made.
- The low attribute refers to the lowest price as of the current date that a request is made. If the request is made on a holiday or a weekend day, then the attribute is for the low price on the prior trading day.
- The closeyest returns the close price for the prior trading day.
Row 4 in the following screen image is for the price attribute of a security.
- The string value (NYSE:KO) in cell A4 points to a security listed on the New York Stock Exchange. The ticker value (KO) following the stock exchange symbol refers to the Coca-Cola company.
- The string value in cell B4 is for the price attribute.
- Cell C4 contains a GOOGLEFINANCE expression that references values in cells A4 and B4.
- The result for the expression ($71.41) shows in C4. The value in C4 shows price attribute value as of the datetime that the sheet was refreshed for the screen shot.
- The expression =GOOGLEFINANCE(A4, B4) demonstrates the syntax for retrieving a real-time attribute. The expression appears towards the top of the screen following “fx”.
Rows 5 through 8 are for attributes priceopen, high, low,
and closeyest. The Google sheet derives its
return value with an updated version of the expression in C4. For example, the expression for cell C5 is
GOOGLEFINANCE(A5, B5).
Cells C11 and C12 are computed in the sheet based on the difference between selected pairs of column values on a row. Cell C11 is for priceopen less closeyest, and Cell C12 is for price less priceopen.
Obtaining Historical Attribute Values for a Security
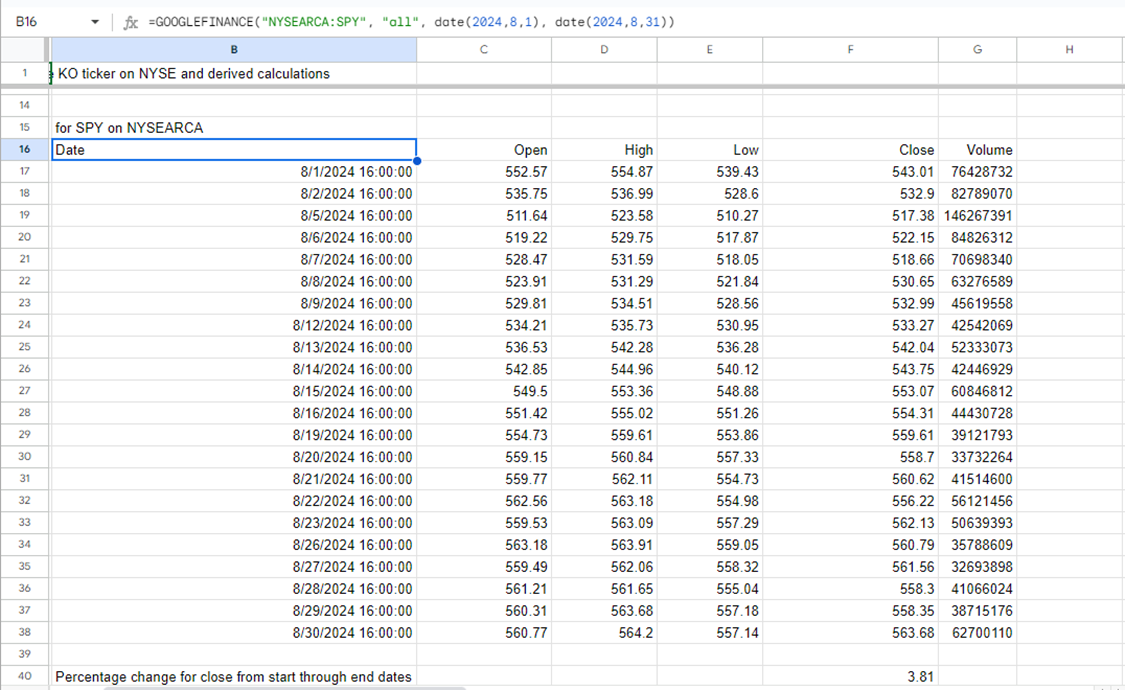
The following screen shot shows a Google sheet with a GOOGLEFINANCE
function for extracting all the historical attributes for the SPY ticker on the
NYSE ARCA exchange. As you can see, historical
attributes are comprised of open, high, low, and close prices along with the
volume of shares traded on each trading day in a date range, such as the
trading days during the month of August 2024.
When you specify “all” as the attribute name in a GOOGLEFINANCE function
call, then all five individual historical attributes are returned. You can also designate individual attributes,
such as open or close.
Notice that the GOOGLEFINANCE function returns close values,
but it does not report adjusted close values.
Yahoo Finance reports adjusted close values in addition to close values. Adjusted close values at Yahoo Finance attempt
to account for corporate actions, such as dividends, for historical data. Dividends reflect payments by a company to
its stockholders beyond gains achieved through trading. Both Yahoo Finance and Google Finance account
for stock splits, another kind of corporate action, in their historical data.
The top of the screen excerpt below displays the GOOGLEFINANCE
function for the historical attribute values appearing in the body of the
following Google sheet. The
GOOGLEFINANCE expression resides in cell B16.
Notice that the expression returns historical attribute values for the
SPY ticker.
- The first date value in the expression is for the start date (August 1, 2024) of the returned historical attribute values.
- The second date in the expression is for the end date (August 31, 2024) of the historical attribute values.
- Stock market holiday and weekend days are omitted from the returned attribute values by the GOOGLEFINANCE function. For example, no values are returned for August 31, 2024, because it is a Saturday.
Cell F40 displays the percentage change for close attribute
values from the start date through the end date. This value is computed with a Google Sheet
expression (=((F38/F17)-1)*100). The
computed percentage value is formatted to show two places after the decimal
point.
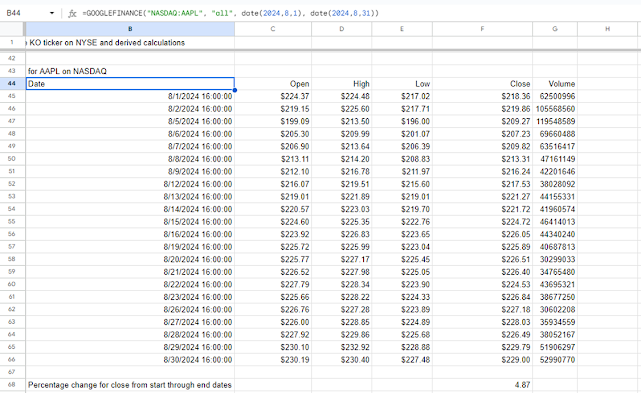
The following screen shot displays the GOOGLEFINANCE expression
and its results set for all the historical attribute values for the AAPL ticker
during August, 2024. The expression
syntax is as follows: GOOGLEFINANCE("NASDAQ:AAPL", "all",
date(2024,8,1), date(2024,8,31)). This expression
resides in cell B44. The AAPL ticker is
for Apple, Inc.
- AAPL historical attribute values are extracted by the GOOGLEFINANCE function from the NASDAQ exchange.
- It is good practice to indicate the exchange symbol in the GOOGLEFINANCE function expression. There are several reasons for this.
- The ticker for a security can be listed on more than one exchange, but the historical prices and volumes are not likely to be identical across different exchanges.
- Furthermore, the GOOGLEFINANCE function reports historical attribute values from only one exchange for a security ticker.
- When a security ticker resides on more than one exchange, you can generate errors from the GOOGLEFINANCE function if you do not specify a valid exchange. Also, others reading your spreadsheet will not know (without some trial and error) which exchange a GOOGLEFINANCE function references.
Notice that the exchange symbol for APPL (NASDAQ) is
different than the exchange symbol for SPY (NYSEARCA); the NYSE ARCA exchange
is represented by the NYSEARCA exchange symbol.
After you designate a valid exchange symbol for the security ticker in a
GOOGLEFINANCE function, you can process the returned historical attribute
values in the same way as any other value in a Google sheet. For example, the percentage change expression
in the following Google sheet excerpt calculates the percentage change in the
preceding screen shot. The percentage
change expression in cell F40 was copied to cell F68. Because the preceding excerpt and the
following excerpt return historical data for the same range of dates, Google Sheets
automatically updates the cell addresses for the copied expression.
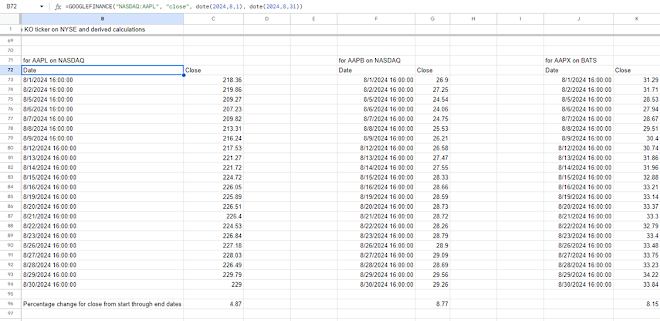
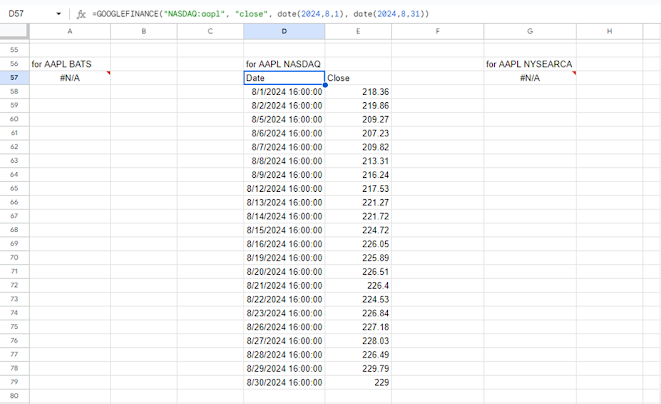
The previous two screen shots illustrate how to download all historical attributes from a start date through an end date for a single security ticker (even if your analysis does not need them). The final set of examples for this section shows historical values for just one attribute per exchange:ticker pair instead of all attributes. The examples in the following screen shot illustrate how to download a single historical attribute for each of three security tickers – namely, APPL, AAPB, and AAPX. The GOOGLEFINANCE function expressions are slightly different for each ticker.
Columns B and C highlight how to download just the close
attribute values for the APPL security ticker.
The cursor is resting in cell B72.
The GOOGLEFINANCE function expression is: GOOGLEFINANCE("NASDAQ:AAPL",
"close", date(2024,8,1), date(2024,8,31)).
- The first parameter indicates that the returned values are for the AAPL security ticker from the NASDAQ exchange.
- The second parameter specifies the single attribute to download (close).
- The third and fourth parameters indicate the start date and end date for the download. These parameters encompass all the trading days in August 2024.
Columns F and G show the results of downloading close
attribute values for the AAPB ticker from the NASDAQ exchange with the
GOOGLEFINANCE function. The AAPB ticker
points at the GraniteShares 2x Long AAPL Daily ETF. This single stock ETF aims to provide twice
the daily performance of AAPL, Inc. The
GOOGLEFINANCE expression resides in cell F72.
The GOOGLEFINANCE function expression is: GOOGLEFINANCE("NASDAQ:AAPB",
"close", date(2024,8,1), date(2024,8,31)). The parameters for this function expression
serve the same role as the expression in B72.
Columns J and K show the results of downloading close
attribute values for the AAPX ticker from the BATS exchange with the
GOOGLEFINANCE function. The AAPX ticker
points at the T-Rex 2X Long Apple Daily Target ETF. This single stock ETF aims to provide twice
the daily performance of AAPL, Inc. The
GOOGLEFINANCE expression resides in cell J72.
The GOOGLEFINANCE function expression is: GOOGLEFINANCE("NASDAQ:AAPX",
"close", date(2024,8,1), date(2024,8,31)). The parameters for this function expression
serve the same role as the expression in B72.
This post is about how to download attribute values with the
GOOGLEFINANCE in Google Sheets. Nevertheless,
some commentary about the results may help you to better appreciate the role of
this kind of analysis for security trading analytics.
- Notice that row 96 displays percentage change values, respectively, for AAPL, AAPB, and AAPX.
- Cells G96 and K96 show percentage change values for AAPB and AAPX, respectively, that are both substantially larger than for AAPL in cell C96.
- Nevertheless, neither the percentage change values for AAPB nor AAPX reaches twice the level of the percentage change for AAPL.
- A caveat about the results in the following screen shot is that a more thorough analysis is likely to lead to much more stable conclusions. For example,
- you could perform the analysis for more than a single month or,
- you could examine percentage change for each individual month instead of all the periods that you can download or,
- you could examine different sets of single stocks and their corresponding single stock ETFs.
At least some, but more likely many, beginners with the
GOOGLEFINANCE function are not likely to know the exchange from which the
function extracts attribute values for a ticker. Although the Google Finance site does contain
a web page for referenced
exchanges, the association between individual stock tickers and the correct
exchange from which to attempt to download attribute values is not documented
to the same level of detail.
Furthermore, if a GOOGLEFINANCE function on a Google sheet references an
incorrect exchange, the function returns an error message instead of an
attribute value. This behavior makes it
possible to identify the correct exchange to reference in a GOOGLEFINANCE function. This section presents several examples of how
to find the correct exchange to reference in a GOOGLEFINANCE function for a
security’s ticker.
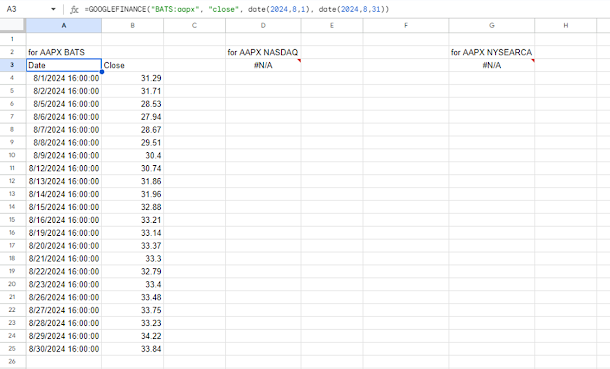
The following screen shot displays the results from three
attempts to download historical close attribute values for the AAPX ticker. Google Finance draws the data values for this
ticker from the BATS exchange.
- The GOOGLEFINANCE expression residing in cell A3 for the first attempt references the BATS exchange.
- A second attempt in cell D3 references the NASDAQ exchange.
- The third attempt in cell G3 references the NYSEARCA exchange.
The GOOGLEFINANCE expression for the first attempt appears at
the top of the following screen shot. Especially
observe the name BATS before the AAPX ticker symbol. The start date and end date parameters
reference, respectively, the first calendar day and the last calendar day in
August 2024. The returned close
attribute values appear in cells B4 through B25.
The second and third attempts fail to return any close
attribute values. Instead of returned
close values, the function returns one instance of “#N/A” in cells D3 and G3. The “#N/A” string denotes an error.
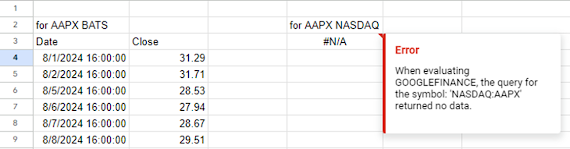
The red arrowhead in top right corners of cells D3 and G3 in
the preceding screen shot indicates that there is an error message associated
with each of these cells. You can hover your
cursor over the arrowhead to display the error message. As you can see in the following screen shot,
the second attempt to download AAPX close attribute values from the NASDAQ
exchange fails because the GOOGLEFINANCE function does not recognize NASDAQ as
a valid exchange for the AAPX ticker.

Comparing GOOGLEFINANCE Close Attributes Values with Those from Yahoo
Finance
The close attribute value from the GOOGLEFINANCE function
and the close value from the Yahoo Finance site both reflect the price for the
last lot of shares exchanged during a trading day after an adjustment for stock
splits. No other adjustments are applied
to these price values.
When a company implements a stock split, the split impacts both
the number and price of shares owned by stockholders. A stock split does not affect the aggregate value
of outstanding shares, but it does modify the price of the shares owned by
stockholders.
- A conventional stock split, sometimes called a forward stock split, increases the number of shares owned by stockholders and reduces the price per share proportionally.
- A reverse stock split decreases the number of shares owned by stockholders and increases the share price proportionally.
Yahoo Finance publishes historical close prices as well as
adjusted close prices. Both price series
are adjusted for stock splits. However, the
adjusted close values reflect the impact of dividend distributions as well as
other corporate actions that can impact the value of a company. The GOOGLEFINANCE function does not return
historical attribute values that are analogous to the Yahoo Finance adjusted close
values.
The following screen excerpt shows close prices from both
Yahoo Finance and the GOOGLEFINANCE function for the SPY ticker during August
2024. The Yahoo Finance values are
derived by copying them from Yahoo Finance site to the following Google sheet. The SPY ticker tracks the S&P 500 index,
which tracks the price performance of the leading securities in the US stock
market.
- The SPY close values from Yahoo Finance appear in column E.
- The analogous close attribute values from the GOOGLEFINANCE function appear in column K.
- The adjusted close attribute values from Yahoo Finance appear in column F.
- The GOOGLEFINANCE close value for each trading day less the Yahoo Finance close value appears in column M.
- The percentage change for close values from start date through end date appear in row 28.
- The percentage change for Yahoo Finance close values appears in cell E28.
- The percentage change for Yahoo Finance adjusted close values appears in cell F28.
- The percentage change for GOOGLEFINANCE close attribute values appears in cell K28.
The single most important set of values for the analysis in
this section are those in column M.
Notice that the differences are all zero. Therefore, the close values from Yahoo
Finance perfectly match the close values from the GOOGLEFINANCE function.
The percentage change for Yahoo Finance close and adjusted
close values is the same as the percentage change of close attribute values
from the GOOGLEFINANCE function. There
are two reasons for the matching percentage change values.
- The Yahoo Finance close values are defined identically to the GOOGLEFINANCE close attribute values (over the date range in this example).
- There are no special corporate actions, such as dividend distributions, that can impact close values during August 2024. Therefore, adjusted close values from Yahoo Finance perfectly match close values for Yahoo Finance, which also perfectly match close attribute values from the GOOGLEFINANCE function.

The following table presents an excerpted set or rows with results
from the Yahoo Finance site and the GOOGLEFINANCE function for trading days
during June, July, and August 2024. They
are divided into three parts:
- The first table row includes results from June 3 through July 9
- The second table row includes results from July 10 through August 16
- The third table row includes
- results from August 19 through August 30,
- the percentage change from the start date through the end date (June 3 through August 30), and
- the amount of a dividend distribution on June 21.
The following table indicates a couple of important points
for those analyzing close values versus adjusted close values from Yahoo
Finance and the GOOGLEFINANCE function.
- Close values from Yahoo Finance and the GOOGLEFINANCE function match perfectly even when there is a dividend in the range of dates being evaluated. Also, the percentage change outcome from the start date through the end date for the Yahoo Finance close values versus the GOOGLEFINANCE function close values is the same at 6.80. This is because the close price series does not reflect dividend distributions.
- On the other hand, the percentage change from the start date through the end date is slightly greater for the adjusted close values (7.18) than for the close values (6.80). This is because the adjusted close values does reflect dividend distributions.


Downloading a Google Sheet to a CSV File
A main objective of this post is to demonstrate that you can
download a csv file based on the contents of a tab in a Google sheet file. You can accomplish this objective by
navigating to the File, Download, Comma Separated Values (.csv) command from the
main menu on a tab. By clicking the
selected menu items, you can download the contents of the current Google sheet
tab to your Windows download folder as a csv file. The following image shows the designated menu
items selected in the sample Google sheet file for the tab referenced in this
section of the post.

The next screen image shows an excerpt from the Google sheet
file named “current and historical googlefinance examples”. The image below is from the “comps from Yahoo
Finance and GOOGLEFINANCE” tab within the sheet file.
- The Google sheet filename appears at the top of the image with the number 1 off to its right edge.
- The tab name appears at the bottom of the image with the number 2 off to its right edge.
Notice the tab within the Google sheet has column values spread across thirteen columns. The columns are named A through M. Some of the columns (B, C, D, and G) are hidden because they contain contents that do not pertain to the current analysis. Other columns, namely, H and I, are blank to enhance the readability of the data being displayed.

When you execute the command to download the tab contents shown
in the preceding image, the contents of the whole sheet are saved in a csv file
within your Windows download folder. The
csv file is named based on a concatenation of the sheet name and the tab name. Here is an excerpt of the csv file shown in a
Notepad++ session. The values in the
image correspond to the first row in the table at the end of the preceding
section.
The closing time returned by the GOOGLEFINANCE function within the second Date column on July 3, 2024, is 13:15:00. Because this day is the day before the July 4 holiday (and all the other closing times are for the normal closing time of 16:00:00), I am guessing that this may be the result of an undetected error, such as an unscheduled early shutdown of the data feed for the second column of Date values from Google Finance. In any event, this completes the demonstration for downloading data from a tab within a Google sheet file to a csv file.

At least some readers of this post may find it difficult to
follow the csv file layout in the preceding screen image. This can because of the complex formatting of
content in the sheet. We have already
referenced hidden columns and columns with blank values. You may also notice that the header for the
last column (column M), is missing from the third row of the csv file; this is because header name for
column M is on the second row instead of the third row – like all the other
header names. These kinds of issues are
not uncommon for typical business applications.
One way of resolving potentially complex formatting issues in downloaded csv files is to simplify the format of a sheet destined for downloading as a csv file. The tab (for download to csv file) in the following screen shot is considerably simplified relative to the preceding excerpt from the “current and historical googlefinance examples”. The tab has just four columns of data values – one column for the dates and three more data columns for data copied from Yahoo Finance or downloaded from Google Finance.

Here is an excerpted display with the first 28 rows of the
csv file downloaded from the “for download to csv file” tab. Notice how much easier it is to map values in
the csv file back to the tab. This alternative
example for downloading to a csv file from a Google sheet may appeal to those
who found the preceding example too complex to follow.

Concluding Remarks
This post illustrates a solution for downloading historical
close values for stock tickers at the Google Finance site to a csv file via the
GOOGLEFINANCE function in a Google sheet.
The Yahoo Finance site has recently disabled its free capability for
performing a comparable feature from its site.
As demonstrated in this post, the only remaining way to obtain
historical close values from Yahoo Finance is to manually copy and paste them
from the Yahoo Finance site to another destination. The Yahoo Finance manual process is both
clumsy and error-prone relative to the alternative approach offered by the
GOOGLEFINANCE function in Google Sheets.
This post also demonstrates that you can programmatically download
current financial values (as opposed to historical values) for stock tickers with
up to a twenty-minute delay from the Google Finance site with the GOOGLEFINANCE
function in Google Sheets. This kind of
capability can be used for tracking portfolio value changes within trading days
as well as across trading days. Yahoo Finance
does not enable a programmatic solution for copying current financial values
from its site. Furthermore, Yahoo
Finance has disabled the ability to programmatically scrape current financial
values from its web pages via third party applications (e.g., Beautiful Soup
library in Python).
This blog previously published several posts that indicate
how to download and analyze Yahoo Finance financial data with the recently
disabled downloading capability from Yahoo Finance. Highlights from these prior posts show the impact
of leverage for ETFs based on major market indexes as well as the comparative
returns from bitcoin securities versus index ETFs based on leading market
indexes. The next examination this blog takes
of the GOOGLEFINANCE function will compare the values returned by the function
from the Google Finance site to prior results obtained with data downloaded
values from Yahoo Finance.


Comments
Post a Comment