Investing in Bitcoin-related
Securities
A prior post titled “Bitcoin USD
Exchange Rates Versus Major Market ETFs” compared growth rates for the bitcoin-USD
exchange rate from the Yahoo Finance site versus exchange-traded funds (ETFs)
for the top 100 securities in the S&P 500 index (OEF) and the NASDA-100
index (QQQ). The comparisons show
bitcoin exchange growth rates are between 5 and 2.9 times greater,
respectively, than for the OEF and the QQQ ETFs.
As inviting as these outcomes are for investing in bitcoins,
you cannot invest directly in bitcoin exchange rates. Furthermore buying, holding, and selling bitcoins
is substantially more complicated and riskier than buying and selling an ETF. Investopedia
features an introduction to some of the mechanics and historical price swings associated
with bitcoin and other cryptocurrencies.
Forbes
lists the top ten risks associated with buying, holding, and selling
bitcoins. Some of these risks are
technology based, others relate to taxation, still others relate to making a
bitcoin inheritance available to your heirs.
Finally, there is the matter of bitcoin price volatility, which can
result in substantial short-term swings in the value of bitcoins.
This post examines price growth for two classes of
bitcoin-related securities that do not require the holding of a digital cryptocurrency,
such as bitcoin. The post focuses on how
these securities grow relative to bitcoin exchange rates. The two classes of securities are for bitcoin
miner firms as well as ETFs for spot or futures bitcoin prices. Since buying, holding, and selling these
security classes is so much less complicated and risky than buying, holding,
and selling bitcoins, many investors may prefer either of the two security
classes covered in this post. There are
other bitcoin-related security classes besides the two covered in this post. Before deciding whether to invest in any
bitcoin-related security, you should research it to assess if bitcoin investing
matches your trading preferences.
Nevertheless, if you can tolerate the complications and risks, bitcoins may
reward you with long-term uber-sized gains.
Bitcoin Miner Stock Prices Relative to Bitcoin Exchange Rates
Bitcoin miners are firms that use specialized hardware and
software to validate and secure new blocks in the bitcoin blockchain. In return for their work, bitcoin miners are compensated
in bitcoins.
- The bitcoin blockchain is a public ledger of transactions that records the exchange of bitcoins.
- An exchange is one where bitcoins are traded for goods, services, or fiat money (for example, US dollars, euros, British pounds, or Indian rupees).
- Miners solve cryptographic puzzles to validate the addition of new one-megabyte blocks to the bitcoin blockchain.
- One resource for learning more about blockchains is available on the Coinbase site. A LinkedIn post gives a helpful synopsis of the role cryptography plays in securing bitcoin transactions.
Here is a table of publicly traded bitcoin miners that this blog regularly tracks. This section compares adjusted close prices for the BTC-USD ticker versus the tickers for selected bitcoin miners. Notice that some of the values in the following table are estimates. This is because inconsistencies exist on the internet for selected miner details, but the information in the table may nevertheless help you to understand factors impacting miner growth rates.
Overview of Selected Bitcoin Miners
|
Company
(Ticker) |
Marathon (MARA) |
Riot Platforms (RIOT) |
CleanSpark (CLSK) |
Bitfarms (BITF) |
Hut 8 Mining (HUT) |
|
Estimate
of Hash Rate (EH/s) |
26.4 |
12.4 |
16 |
5.3 |
7.2 |
|
Estimate
of Bitcoin Holdings |
15,741 |
7,648 |
4,218 |
4,386 |
9,102 |
|
Market
Cap (as of Mar 3, 2024) |
$9.34B |
$9.96B |
$1.72B |
$1.13B |
$1.82B |
|
Estimate
of first trade date as a miner |
1-Feb-21 |
1-Feb-20 |
1-Oct-20 |
16-Aug-19 |
8-Mar-18 |
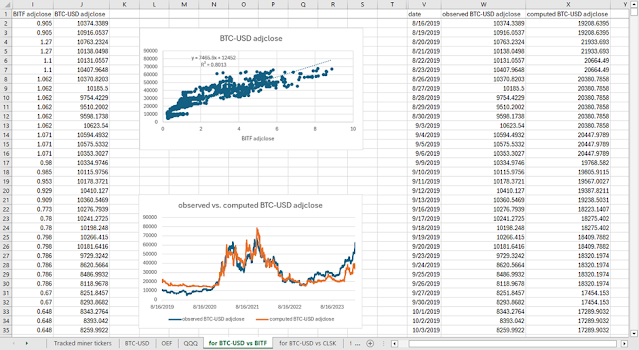
The ticker price comparisons reported in this post were implemented in an Excel spreadsheet. The steps for deriving the compared values is presented in “Bitcoin USD Exchange Rates Versus Major Market ETFs”. The comparisons were performed in Excel because of its built-in statistical and visualization features for assessing how two series compare to one another. The following excerpt from an Excel worksheet reveals values for comparing the prices for the BITF miner to the BTC-USD exchange rate.
- Columns I and J show the adjusted close prices for the BITF miner stock and BTC-USD ticker, respectively.
- The actual dates appear in column V.
- The least recent date, which appears in row 2, is 8/16/2019.
- The most recent date, which resides in row 1143, is 2/29/2024.
- The top chart with the heading of BTC-USD adjclose displays a scatter chart of BITF adjclose values versus BTC-USD adjclose values from columns I and J, respectively. A linear trend line passes scatter points. The y values from the trend line denote computed estimates of BTC-USD adjclose prices derived from the linear trend with x values populated from BITF adjclose values. The computed BTC-USD adjclose values appear in column X.
- The second chart is a line chart with a heading of observed vs. computed BTC-USD adjclose. This chart plots dates along the horizontal axis.
- The blue line is for observed BTC-USD adjclose values.
- The orange line is for computed BTC-USD adjclose values.
- While the blue and orange lines do not perfectly overlap each other, the two lines typically denote correspondingly rising or falling adjclose values.
- This line chart correspondence is further supported by the .8013 R2 value for the top scatter chart. This R2 value confirms that when a BTC-USD adjclose value is large relative to other BTC-USD adjclose values, then its matching BITF adjclose value is also large relative to other BITF adjclose values.
The next display presents the two charts for each bitcoin miner in a side-by-side layout. As you can see from the preceding display, each chart compares miner bitcoin stock prices to bitcoin coin exchange rates for US dollars in a different way.
- The left chart in each pair is a scatter chart of bitcoin miner ticker prices versus bitcoin exchange rates in US dollars. without respect to when a matching pair of values occurred.
- The right chart in each pair contains a pair of line chart values by date.
- The blue line is for the observed BTC-USD adjclose values.
- The orange line is for the computed BTC-USD adjclose values derived from the trend line in the left chart.
- The first through the fifth pair of charts are consecutively for BITF, CLSK, HUT, MARA, RIOT. The starting date for each pair of charts varies based on the estimated start date for when a miner started mining bitcoins.
As you can see, there is a substantial amount of correspondence
across miner tick symbols. Some specific
correspondences are highlighted below.
- All five miner tickers have a positive sloping trend line between their adjclose values and BTC-USD adjclose values. Furthermore, except for the CLSK ticker symbol, the R2 values are all greater than .6. This means that for each of the remaining four miners (BITF, HUT, MARA, and RIOT) more than sixty percent of the BTC-USD adjclose variance is explained by the computed miner adjclose values.
- Also, all five miner tickers computed BTC-USD adjclose values peak around the middle of November during 2021, which matches a corresponding peak value in the observed BTC-USD adjclose values.
- All miner tickers, except for HUT, have computed BTC-USD adjclose values that rise during the ending months of 2023 and through the beginning pair of months in 2024. While the observed values rise more sharply, the miner ticker adjclose values also generally rise during this same period.
- Finally, there is a general tendency for peaks and valleys to appear in each line chart for the observed and computed adjclose values at synchronized dates.

Bitcoin ETF versus BTC-USD Close Price and Performance
Since early 2024, the Securities and Exchange Commission (SEC)
approved multiple new ETFs that track bitcoin spot prices. This section looks at five ETFs for bitcoin spot
prices plus one ETF for bitcoin futures prices.
The following table gives the tickers for the bitcoin ETFs tracked in
this section.
Overview of Selected Bitcoin ETFs
|
Ticker |
Name |
Launch
Date |
Type |
|
ARKB |
ARK 21Shares
Bitcoin ETF |
1/11/2024 |
Spot prices |
|
BITB |
Bitwise
Bitcoin ETF |
1/11/2024 |
Spot prices |
|
BITO |
ProShares
Bitcoin Strategy ETF |
10/20/2021 |
Futures
prices |
|
FBTC |
Fidelity Wise
Origin Bitcoin Fund |
1/11/2024 |
Spot prices |
|
GBTC |
Grayscale
Bitcoin Trust |
5/11/2015 |
Spot prices |
|
IBIT |
iShares
Bitcoin Trust |
1/11/2024 |
Spot prices |
All ETF prices in this section start on 1/11/2024 and end on
4/9/2024, the final date for which data was collected for this post. This range of dates is different from the
dates in the preceding section because most of these ETFs in this section only
became available for trading in early 2024.
GBTC was available for sale well before the other bitcoin
spot price ETFs under a more restricted set of regulations than the other bitcoin
spot price ETFs tracked in this tip.
GBTC converted to the rules for the other bitcoin spot price ETFs around
the launch date of the other bitcoin spot price ETFs tracked in this post.
BITO seeks price appreciation through buying and selling bitcoin
futures price contracts. A futures price
is based on a contract to buy or sell something at a point in the future. Unlike the bitcoin spot price ETFs, BITO does
not buy, hold, or sell bitcoins. Instead,
BITO trades in futures contracts.
All the ETFs tracked in this section offer exposure to
bitcoin prices while avoiding the difficulties of directly buying, holding, and
selling bitcoins. You can buy, hold, and
sell bitcoin ETF shares just like any other kind of ETF. Recall that a previous post showed that bitcoin
exchange growth rates were up to five times greater than leading ETFs based on
the S&P 500 index.
The following excerpt from an Excel workbook tab shows two
different criteria for comparing bitcoin ETF close prices to BTC-USD close
prices. One reason for using close
prices instead of adjusted close prices is that the evaluation time is based on
just 61 days. Therefore, dividends,
which are accounted for by adjusted close prices but not by close prices, do
not have much time to impact prices significantly in the analyses for this
section.
There are six Excel worksheet tabs for tracking and the six
bitcoin ETFs ticker close prices in this section to the BTC-USD ticker for
bitcoin exchange rates. The following
display shows an excerpt from the first tab for comparing ARKB to BTC-USD.
There are two types of comparisons.
- The first comparison is for comparing ARKB close prices to BTC-USD close prices. The data for this comparison resides in worksheet columns I and J. The dates for the close prices appear in worksheet column U.
- The second comparison is for percentage change for the current date versus the start date, such as 1/11/2024. If the price for the current date is greater than the price for the start date, then percentage change will be positive. If the current date’s price is less than the price for the starting date, then the percentage change will be negative. This metric is sometimes called performance because the more positive the percentage change, the greater the performance of prices over time relative to the start date. Similarly, negative percentage change values point to performances that result in a value below the start date.
- The BTC-USD performance scores appear in worksheet column V.
- The ARKB performance scores appear in worksheet column W.
- The dates for performance score values appear in worksheet column U.

- The main take-away from the charts in the left column is that the trend line passing through the points for ETF ticker close values versus BTC-USD ticker close values has an R2 value that is nearly one for all tickers. Even without considering the R2 value, it is easy to see that all points in the scatter chart are very close to the trend line that passes through them.
- A second take-away is that the performance charts in the right column all show charts with two lines that regularly overlap one another. The charts in the right column end with different performance scores across bitcoin ETF tickers. However, the daily performance scores are very close to their matching daily BTC-USD performance scores. This is a consequence of the fact that the bitcoin ETF are designed to track their underlying index on a daily basis. As you can see, the tracking is very accurate on a daily basis.

Concluding Comments
Bitcoin ETF close prices examined in this post (ARKB, BITB,
BITO, FBTC, GBTC, and IBIT) track underlying BTC-USD exchange rates very
closely on a daily basis. The bitcoin
miner share prices also generally track BTC-USD exchange rates, but not nearly
as closely as the bitcoin ETFs.
Therefore, this post’s top line conclusion is to invest in a bitcoin ETF if you seek an
investment vehicle that matches the returns of the BTC-USD ticker.
Bitcoin ETFs achieve their returns without many of the
hassles associated with buying, holding, and selling bitcoins. If you know how to buy shares in an ETF, then
you can skip the complications and risks of buying, holding, and selling
bitcoins and still get the same results, which we previously indicated have
growth rates of 5 to 2.9 times the leading stocks in the S&P 500 and the
NASDAQ 100 index, respectively.
The bitcoin mining industry is dependent, in part but not
wholly on BTC-USD exchange rates. The
reason for the dependence is because bitcoin miners are rewarded in bitcoins
for their work in extending and maintaining the bitcoin blockchain. It can take a lot of energy to add new blocks
to the bitcoin network, and therefore miners find it advantageous to locate
their mining facilities near low-cost, renewable energy supplies. Also, rewards to miners reduce by half after
each new set of 210,000 blocks is discovered.
A halving date is likely to occur towards the end of April 2024. Some prior analysis suggests
that gains in bitcoin prices are associated with halving dates.
This blog is likely to produce additional bitcoin-related
posts, but the main objective of this blog is security trading analytics. Thus, bitcoin-related posts will have to
share the spotlight with other topics bearing on security trading analytics. In the meantime, please consider sending a message
to RickDobsonBlogs@gmail.com with any questions you have about the analyses presented in this post, security
trading analytics, or bitcoins.


Comments
Post a Comment