An Assessment of Selected Bitcoin-Related Securities from 2020 Through 2024
One of the most successful trading themes in 2024 was
trading bitcoin-related securities. This
post assesses success for selected bitcoin-related tickers relative to one widely
traded non-bitcoin security as well as an index of bitcoin value. An
earlier post examines outstanding performances by other securities during
2024.
The bitcoin-related financial tickers tracked in this post
include MSTR, GBTC, and MARA. These
tickers are assess relative to two benchmark tickers -- namely, SPY and BTCUSD.
- MSTR is the ticker for a firm that began as a business intelligence and analytics firm. Starting in 2020, the firm began transforming itself into a bitcoin treasury so that it now has one of the world’s largest bitcoin holdings (around 440 thousand and growing at a relatively rapid pace).
- GBTC originated as a bitcoin trust, but it converted to a bitcoin ETF in January 2024. GBTC is only the second largest bitcoin ETF (IBIT is the largest). However, GBTC started operating as a bitcoin trust during 2013 so that it has a longer history of operation than any of the other bitcoin ETFs. As of the preparation of this post, Its bitcoin holdings are around 203 thousand.
- MARA is among the leading publicly traded bitcoin miners. Its current bitcoin holdings are around 27 thousand.
- SPY is the largest and earliest ETF for the S & P 500 index. Therefore, this ETF reveals the price trends for leading U.S. securities. The ETF’s performance is widely reported in financial publications and on the internet.
- BTCUSD at the Google Finance site denotes the exchange rate of a bitcoin in U.S. dollars. This exchange rate was around $104,000 at the time of this post’s preparation.
As with other recent posts from this blog, the data analyzed herein was collected with the GOOGLEFINANCE function in Google Sheets, which extracts historical data from the Google Finance site. You can view demonstrations of the GOOGLEFINANCE function from these prior posts (“GOOLEFINANCE Function in Google Sheets Can Download Historical Data via CSV Files”, “Do Returns from the GOOGLEFINANCE Function In Google Sheets Match Returns from Yahoo Finance?”, and “Assessing Returns for Stocks In Watchlists”). The demonstrations in this post go beyond earlier posts in that they feature line and bar chart data visualizations for revealing growth rates for select bitcoin-related securities (MSTR, GBTC, and MARA) relative to benchmarks (BTCUSD and SPY).
BTCUSD Exchange Rates Google Sheet Workbook
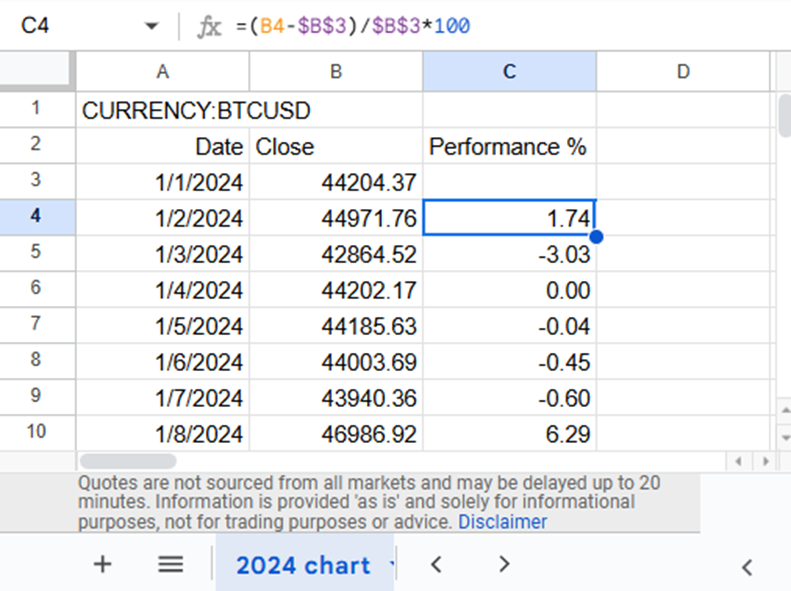
The following pair of screenshots show the first and last ten rows for the collection of BTCUSD values for years 2024 back through 2020 in a Google Sheets workbook named BTCUSD Performance. The expression, which appears in cell A2, is for populating cells in columns A and C on the Daily Closes 2020 – 2024 tab. The expression’s format is: =GOOGLEFINANCE(A1, "close", "2024-01-01", "2025-01-01", "DAILY"). The expression assigns five parameters to the GOOGLEFINANCE function.
- Cell A1 designates the string value CURRENCY:BTCUSD as the identifier for which to download values. This string indicates how to reference the BTCUSD exchange rate at the Google Finance site.
- Close references the BTC price at the close of a calendar date. Therefore, the close price for a bitcoin at the end of 1/1/2024 is $44204.37. As you can see, the date appears in column A, and the price appears in column B.
- The strings 2024-01-01 and 2025-01-01 set, respectively, the start and end dates for the date and close price values in columns A and B. The strings aim to collect data from the first through the last calendar dates in 2024.
- The interval for collecting data is specified by the string with a value of daily. A prior post(“Assessing Returns for Stocks In Watchlists”) demonstrates how to specify return weekly close price values from the GOOGLEFINANCE function.


The term Performance % in this post refers to the ratio
multiplied by 100 of the difference in close prices between any calendar date
after the first date in a year or a set of calendar years. The next two screenshots focus on the
Performance % value for the second and third rows from the column C
(Performance %) relative to the first row in calendar year 2024. The second row has a computed Performance % value
of 1.74. This is because the close value
on 1/2/2024 is 1.74 percent greater than the close value on 1/1/2024. On the other hand, the Performance % value on
1/3/2024 is -3.03, which indicates the third row’s close value on 1/3/2024 is
slightly more than 3 percent less than the close value on 1/1/2024.

The following screenshot highlights a Performance % value of
108.99 for 12/31/2024. This indicates
that the close value on 12/31/2024 is slightly more than one hundred percent
greater than the close value on 1/1/2024.

The next screenshot shows a line chart with Performance %
values versus date values during 2024 for BTCUSD. The line chart was created on a Google sheet by
hiding the values in column B before selecting rows 3 through 367 in columns A
and C. Then, the Google Sheets command
Insert, Chart was invoked. Minor
customizations include adding a chart title as well as vertical and horizontal axis
titles. To generate the following chart,
you may also need to designate the chart type as line.
As you can see the Performance % values rise substantially
through the January-February months and the November-December months in 2024. Also, the Performance % value for the final
day of 2024 (108.99) appears in a Google sheet cell below the chart of
Performance % values by date values for 2024.

The final screenshot for this section is from the 2020 –
2024 chart tab of the BTCUSD Performance workbook. This tab shows a line chart with daily
Performance % values relative to the 1/1/2020 for all calendar dates through
12/31/2024. Therefore, the Performance %
values reflect close value changes from the first calendar day after 1/1/2020 in
2020 through the final calendar day in 2024.
Below the chart is a set of cells showing the Performance % values by
year and across all five years.
Performance % values are positive in all years, except for 2022. During this year, the Federal Reserve
radically escalated its federal funds rate to combat inflation caused by
measures initiated by the Congress to combat the Covid-19 pandemic that started
in early 2020 within the United States.
Over all five years, the exchange rate grew by 1185.69 percent.

SPY Performance % values
The preceding section presents an overview of the BTCUSD
ticker for the five years from 2020 through 2024. For example, during this five year period,
the Performance % value is 1185.69.
However, there is no context for interpreting the significance of
1185.69. One way to provide a context is
to populate a new set of Performance % values in a new Google Sheet workbook for
a comparison ticker. In this post, we
use the SPY ticker for a benchmark that serves kind of like a ruler for
assessing the Performance % values from the BTCUSD Performance workbook.
One especially easy way to generate the Performance % values
for the SPY ticker is to make a copy of the BTCUSD workbook. Next, rename the copied workbook SPY
Performance. Finally, replace the
strings for which you want Performance % values from CURRENCY:BTCUSD to SPY.
The following screenshot shows the first ten rows from the
Daily Close 2020 – 2024 tab. As you can see,
cells A1, D1, G1, J1, and M1 are populated by the string SPY instead of the
string CURRENCY:BTCUSD. You need to make
the same kind of revisions throughout the other tabs in the SPY Performance
workbook.

For example, the next screenshot shows both the data and a chart for Performance % values by date for the SPY ticker from 2020 through 2024. This chart is analogous to the chart at the end of the preceding section except that it is for the SPY ticker instead of the BTCUSD ticker as in the preceding section. One especially noteworthy point is that the SPY ticker has a Performance % value of 80.40 whereas the BTCUSD has a Performance % value of 1185.69.

The next screenshot shows a side-by-side comparison of two column charts comparing the CURRENCY:BTCUSD versus the SPY Performance % values. As you can see, this excerpt is from the BTCUSD vs. SPY Performance tab in the BTCUSD workbook. The values being plotted are those below each chart. The chart on the left shows Performance % values by year with blue columns for the BTCUSD ticker and red columns for the SPY ticker. The chart on the right shows Performance % values across the years from 2020 through 2024.
With one exception, the blue columns in the left chart are more positive. The one exception is for 2022 when the blue column is more negative than the red column. This is because in 2022 the Federal Reserve initiated a contraction of the U.S. economy with a series of federal funds rate increases.
The height of the blue and red columns in the right chart visually contrasts the size of the gains for the CURRENCY:BTCUSD ticker and the SPY ticker. This visualization dramatically portrays the difference in the magnitude of the gains for the two tickers.

MSTR, GBTC, and MARA versus BTCUSD and SPY
In different ways BTCUSD and SPY can both serve as benchmarks. SPY is a good benchmark when you want to show how a ticker performs relative to the leading stocks in the U.S. stock market. BTCUSD reflects the strength of bitcoin in U.S. dollars. As you can see from the preceding section, comparing SPY and BTCUSD tickers conveys a general impression for the Performance % values for leading U.S. stocks versus the value of bitcoins. For example, from 2020 through 2024, the worth of bitcoins increased nearly fifteen times as much as the S & P 500 stocks!
This section looks at three leading bitcoin-related
securities and compares their performance to both the BTCUSD ticker and the SPY
ticker. The left chart below compares
the Performance % values by year for MSTR versus both BTCUSD and SPY. The chart on the right compares the
Performance % values across the years 2020 through 2024 for MSTR versus
both BTCUSD and SPY. Recall that MSTR
operates primarily as a bitcoin treasury that stives to have a massive number
of bitcoins, which is rapidly growing over time. You can review the
potential risks and rewards of the MSTR strategy in Forbes.
As you can see from the left chart, the MSTR ticker has a
superior performance to the SPY in 3 of 5 years. In one of these years, MSTR Performance %
value was just barely behind SPY Performance % value (28.06 versus 28.79). The only year in which MSTR significantly underperformed
SPY was 2022 when the Federal Reserve started rapidly escalating the federal
funds rate to combat inflation. In 2022,
MSTR, BTCUSD, and SPY exhibited negative performance changes, and MSTR exhibited
the most negative performance change. In
2023 and 2024, MSTR showed substantially more positive performance than either BTCUSD
or SPY.
The chart on the right showed dramatically higher performance
gains from 2020 through 2024 for MSTR than either BTCUSD or SPY. This means that if you bought and held MSTR
at the beginning of 2020 and did not sell it until the last day in 2024 you
would have earned nearly fifteen times as much than if you bought and held SPY
over the same five-year interval.
However, as you can see from the chart on the left, the path to that
fifteen time performance gain was very bumpy.

The next pair of charts compares GBTC to both BTCUSD and SPY. GBTC operates as a bitcoin ETF, whose price per share aims to reflect the price of bitcoins at any point in time. GBTC had about the same performance change in 2020 and 2024 as BTCUSD. In 2023, the performance change for GBTC was substantially larger than for BTCUSD. In 2021 and 2022, GBTC share price changes trailed BTCUSD exchange rates changes. GBTC had more positive performance change values than SPY in 2020, 2023, and 2024. Despite these shifting performance change percentages, GBTC had a larger overall performance change by a substantial margin than SPY over the period from 2020 through 2024.

The next pair of charts compares MARA to both BTCUSD and
SPY. MARA is a leading bitcoin miner
that also holds bitcoins in its company treasury. MARA performance has more positive values
than BTCUSD in 2020, 2021, and BTCUSD in 2023.
In 2022 and 2024, MARA has a more negative Performance % change than
either BTCUSD or SPY.
From 2020 through 2024, MARA has a more positive performance
change by a wide margin than SPY. Its
performance relative to SPY was in between MSTR and GBTC.

Concluding Comments
This post introduces you to two benchmark tickers (BTCUSD
and SPY) for evaluating the performance of bitcoin-related tickers – namely,
MSTR, GBTC, and MARA. The specific
evaluation examined in this post was the five-year interval from the start of
2020 through the end of 2024. Ticker
performance was evaluated across the full five-year interval as well as on a
yearly basis within the five-year period.
For the three bitcoin-related securities in this post,
bitcoin-related security performance substantially outpaced S & P 500
performance as indicated by the SPY ticker across the full five-year
period. However, there was also
substantial variation in performance comparisons on a year-to-year basis.
If history is a prologue to the future and you are following
a buy-and-hold strategy, the results in this post suggest that bitcoin-related
securities can be an attractive holding for your portfolio. Also, there is some indication that downside
risk diminishes over time because the full five-year Performance % values for
all three bitcoin-related securities were all substantially and consistently
better than Performance % values for the SPY.
In contrast on a year-to-year basis, the SPY ticker occasionally
returned superior Performance % values than some bitcoin-related securities.
The general topic of this post seems to be one that merits
further investigation because of the potential for outsized gains and
risks. Please consider leaving a comment
with any specific related items that you want examined in future posts from
this blog.


Comments
Post a Comment