What are Single-Stock ETFs and Should I Invest in Them?
Single-stock ETFs are different than traditional ETFs. Traditional ETFs offer a single security that tracks a collection of stocks, but the collection of stocks can be bought and sold like a single security. The collection of stocks underlying a traditional ETF supports diversification and thereby mitigates the risks associated with any one stock in the collection. Single-stock ETFs are based on just one stock, and they do not provide the benefit of diversification available from traditional ETFs.
ETFs can be geared or not geared. A geared ETF aims to return a price change that is 1.5, 2, 3 or some other multiple value on the ETF’s price change during a day. Therefore, if an ETF’s price change is +2 percent and the gear ratio is 2, the geared ETF’s price rises by 4 percent on that trading day. In contrast, if an ETF’s price change is -2 percent on a trading day and the gear ratio is 2, then the ETF’s price declines by 4 percent. Because of the way compound interest works across compounding periods, this geared ETF feature can amplify a price rise or price decline across multiple trading days beyond the gear ratio for a single trading day.
When trading single-stock ETF, gearing can be a primary motivation for buying and selling shares. Traders of geared single-stock ETFs should be especially careful to acquire ETFs with outstanding price growth potential. In addition, always consider using stop-loss orders to minimize amplified price losses relative to amplified price gains.
A single-stock ETF is a relatively new trading vehicle. As a result, the number of single-stock ETFs is small compared to the number of stocks. For example, in response to the prompt “how many single-stock ETFs are there”, Google Chrome replies that there are 96 single-stock ETFs as of December 2024. In contrast, Google Chrome replies to a “how many stocks are there” prompt that there are over 12,000 publicly traded stocks on the NYSE, NASDAQ, and OTC markets as of August 2024. Although the number of publicly traded stocks is vastly greater than the number of single-stock ETFs, the potential for amplified returns from single-stock ETFs is driving very rapid demand growth for more single-stock ETFs.
Some Stocks and ETFs Tracked in This Blog Post
Price changes for ETFs and their underlying securities can vary over time depending on the periods being examined. In addition, percentage changes for the same set of periods can also vary depending on the gear ratio.
This post section and the following one evaluates the performance of 10 single-stock ETFs. Comparisons are made across the 10 ETFs as well as for the single-stock ETFs versus their underlying stocks.
The comparisons use the timeframe during which a leveraged ETF is available for trading from its launch date through January 31, 2025. The launch date is the start date for comparing a single-stock ETF to its underlying ticker. The end date for comparisons is January 31, 2025 (the last date through which data is collected for the comparisons reported in the next post section).
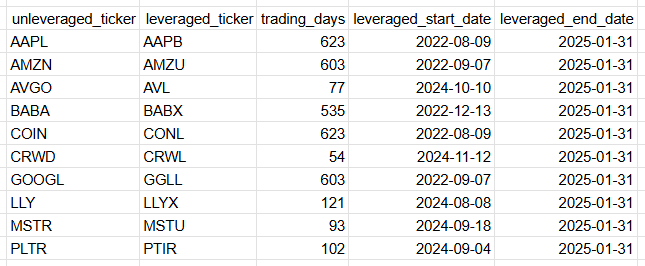
The following table shows the start and end dates for each of 10 single-stock ETF tickers along with their underlying stock tickers. Geared ETFs are often referred to as leveraged ETFs when the gear ratio is positive and greater than 1.
The earliest start date for a single-stock ETF is August 9, 2022 for the AAPB leveraged ETF. The ticker for this ETF’s underlying stock is AAPL.
The most recent start date for a single-stock ETF is November 12, 2024 for the CRWL leveraged ETF. The ticker for this ETF’s underlying stock is CRWD.
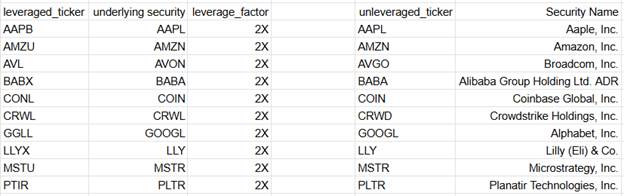
The next table drills down on some key features for the geared ETFs whose performance is tracked in the next section. This table lists the tickers for all 10 single-stock ETFs as well as tickers for their underlying stocks and the gear ratio for each ETF. The first column lists the single-stock ETF tickers. The second through the fifth columns are for feature sets that match the leveraged tickers.
The second column displays the underlying stock ticker for each ETF ticker.
The third column shows that all the leveraged tickers tracked in this post have the same leverage factor -- namely, 2.
The fourth column reveals the ticker for each underlying stock.
The firth column presents the name for each underlying stock.
Tracking Results for 10 Single-Stock ETFs and Their Underlying Stocks
This section compares performance results within and between the leveraged single-stock ETF tickers and their matching unleveraged underlying tickers. Because performance results for the leveraged tickers depend on the performance of unleveraged underlying tickers, it is important to know about unleveraged performance results when trying to interpret the significance of performance differences between leveraged ETF tickers.
The table below shows the percentage change for each of the 10 unleveraged tickers. The first 10 data rows in the table are sorted from largest to smallest performance percentage change. Below the first 10 data rows are 3 summary analysis rows with the average percentage change for the top 5 rows, the bottom 5 rows, and all 10 rows.

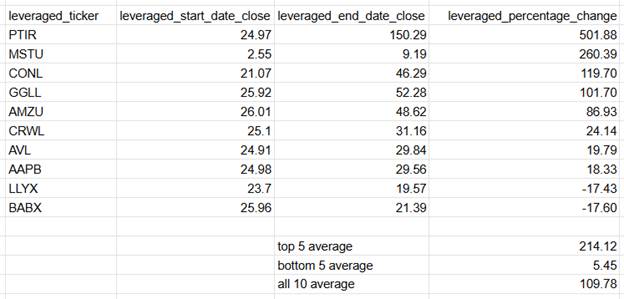
The next table presents comparable metrics for each of the 10 leveraged tickers. The tickers in this table are sorted by values in the leveraged_percentage_change column values.
Here is a summary of selected key points that merit your attention.
· The all 10 average for the leveraged tickers is about 29 points larger than for the unleveraged tickers. This outcome indicates that for these 10 pairs of leveraged and unleveraged tickers, performance is better on average for the leveraged tickers.
· The top 5 average for the leveraged tickers is also about 69 points larger than for the unleveraged tickers, but the bottom 5 average is about 11 points lower for the leveraged tickers. Leveraged tickers amplify the performance outcome (whether up or down) relative to unleveraged tickers.
· The top five and bottom five tickers for the leverage and unleveraged tickers are for the same underlying stocks and matching ETFs. For example,
o The top 5 unleveraged tickers (COIN, PLTR, MSTR, GOOGL, AMZN) correspond to the top 5 leveraged tickers (PTIR, MSTU, CONL, GGLL, AMZU).
o The bottom 5 leveraged tickers (CRWL, AVL, AAPB, LLYX, BABX) correspond to the bottom 5 leveraged tickers (AAPL, AVGO, CRWD, BABA, LLY).
· Finally, the performance percentage change for the top two leveraged tickers substantially exceeds performance percentage change for any other leveraged or unleveraged tickers. This, again, confirms that leveraged tickers have the potential to amplify performance changes – especially for single-stock ETFs having outstanding gains.
Two Performance Chart Comparisons
This section presents two performance charts that illustrate how performance can change over time for two single-stock ETFs with outstanding growth potential. The ETF tickers are PTIR and NVDU. As indicated in the preceding section, the PTIR ticker returned superior performance relative to all 10 ETF tickers examined in the preceding section. The second-best performing stock of 2024 was Nvidia Corporation (NVDA) which has a single-stock ETF ticker of NVDU. You can use the two charts presented and described in this section as a framework for graphically displaying the performance of any leveraged single-stock ETF to its matching unleveraged underlying security.
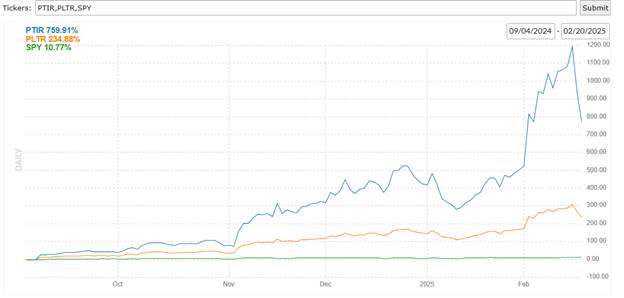
The previous section identified PTIR as the leading single-stock ETF. The following chart shows daily performance change from the PTIR launch date (September 4, 2024) through February 20, 2024. The chart also displays daily performance changes over the same timeframe for the PLTR and SPY tickers. The previous two sections indicate that the PLTR ticker denotes the underlying security for the PTIR ETF. The SPY ticker denotes the State Street ticker for the S & P 500 index. This ticker is for the leading 500 securities in the U.S. stock market.
The final performance change percent for the PTIR ticker from September 4, 2024 through the morning of February 20, 2025 is 759.91. This percent change vastly exceeds percent changes of 234.88 and 10.77, respectively, for the PTIR and SPY tickers. The direction of the daily percentage changes for the PLTR ticker approximately corresponds to those for the PTIR ticker. The compounding effect of the generally increasing PLTR percent changes causes its line to fall progressively below the line for the PTIR daily performance percent changes. This is because of the leverage associated with the PTIR ticker. If you seek a larger performance percent change, it is evident that for the analyzed timeframe the PTIR ticker is a substantially better investment choice than either PLTR or SPY tickers.
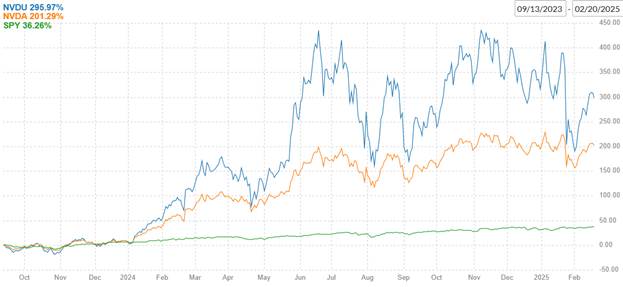
The next chart reveals the daily performance percent changes for the NVDU ticker relative to NVDA and SPY tickers. The NVDU ETF has a leverage factor of 2 relative to its underlying security with a ticker of NVDA. The launch date for the NVDU ticker is September 13, 2023. The following chart also adds a benchmark line based on the SPY ticker. This chart, like the preceding one, plots daily percent changes from the launch date for the single-stock ticker through the morning February 20, 2025.
The cumulative percentage change for the ETF ticker (NVDU) exceeds the cumulative percentage changes, respectively, for NVDA and SPY. The NVDU ticker shows superior growth versus the other two tickers starting around early 2024. The superior gains in 2024 and 2025 for the ETF security are fueled by the gains for the underlying security (NVDA) and compound interest across trading days. During the latter months of 2023, the daily percent changes are approximately the same for NVDA, NVDU, and SPY tickers. This outcome reinforces the fundamental principle that a leveraged ETF only amplifies gains when there are gains in its underlying security. Adjust your holding time for leveraged ETFs accordingly.
Concluding Comments
Single-stock ETFs are different from traditional ETFs in that single-stock ETFs do not attempt to minimize risk by basing their returns on a basket of securities. Instead, single-stock ETFs base all their returns of a single stock. When the single stock is doing well, then the single-stock ETF will do well.
By trading single-stock ETFs with a leverage factor, you can amplify the returns from single-stock ETFs relative to returns from their underlying security. However, if the returns during a timeframe are negative or even slightly positive, then geared or leveraged single-stock ETFs will generate greater losses than their underlying security.
Performance charts that compare single-stock ETFs to their underlying security and the SPY ticker offer a means of visually screening leveraged single-stock ETFs that are good candidates for trading. Examples showing how to do the screening are presented in the final section within this post. As with all types of securities, it is best to initiate a trade only after the security confirms it is in an uptrend. Because single-stock ETFs are attractive because of their volatility, you may want to especially consider using stop-loss orders with your single-stock ETF trades.


Comments
Post a Comment