Can Leveraged ETFs Safely Grow
Long-Term Investments?
This post compares the performance of five pairs of
ETFs. Within each pair is an unleveraged
ETF and a leveraged ETF based on five different market indexes. Read on to learn if leveraged ETFs consistently
outperformed unleveraged ETFs in the long run.
The ETFs are compared over three different timeframes: since
the ETF initially started trading (its launch date), over the last five years
of trading, and over the next to last five years of trading. By long-term investment, this post means
buying-and-holding an ETF for a period
of several years or decades – not just a couple of weeks, days, or minutes within a day. The first of the three timeframes begins with
the launch date for an ETF. Because
different ETFs can have different launch dates, the first timeframe can start on
different trading dates for different ETFs.
ETFs are compared in this post via their overall percentage
change and compound annual growth rate (cagr) for each of the three
timeframes. When the overall percentage
change is positive, then the ETF safely grows the assets allocated to a
long-term investment; that is, there is no loss of capital. The larger the cagr value is for an ETF, the
greater the compound annual growth is for the assets allocated to a long-term
investment. The greater the tendency for
an asset to grow from one year to the next, the greater the likely cagr for an asset
over a timeframe. This post also
compares leveraged ETFs to the SPY for those who seek a benchmark perspective
of the results.
The following table lists the five pairs of unleveraged and
leveraged ETFs tracked in this post along with the underlying market index for
each pair of ETFs. The reason for using
five different underlying market indexes is to capture results for different
types of security assets.
A Quick Introduction to ETFs and Market Indexes
An ETF is an investment fund that trades like a stock, bond,
or commodity on a market exchange. An
investment fund typically tracks other securities, such as a collection of the
top 500 stocks on the US stock exchanges (S&P 500 index). ETFs can be bought and sold at any time
during a trading day.
Mutual funds, which are early predecessors of ETFs, are also
investment funds that do not trade on market exchanges. Mutual funds are bought and sold from the
company sponsoring the investment fund.
Mutual fund firms allow investment fund shares to be bought and sold at
the end of a trading day based on its net asset value at that time.
The SPY AND SPXL tickers denote two different ETFs. The SPY is an unleveraged ETF based on the
S&P 500 index. When the S&P 500
index falls in price by one percent from the close of trading on the previous trading
day, then the SPY also falls by one percent at the time of purchase on the
current trading day. Similarly, if the S&P
500 index goes up by one percent from the close on the previous trading day,
then the SPY also goes up by one percent on that same day.
The SPXL ticker denotes a triple leveraged ETF. The price of the SPXL ticker also rises and
falls based on its underlying index, which is the S&P 500 index – just as
for the SPY ETF. However, the SPXL ETF
is leveraged by a factor of three. If
the price falls by 2 percent from the close of the previous trading day as of when
an SPXL share is purchased, the purchase price is 94% of the close price on the
previous trading day. Similarly, if the
price rises by 2 percent from the close of the previous trading day, the
purchase price rises by 6 percent from the close of the previous trading day. The leverage factor of three combined with
compounding over successive trading days can cause the price of the leveraged SPXL
ETF to change much more rapidly over several trading days than the unleveraged
SPY ETF.
Most market indexes are based on the weighted average of the
capital for the individual stocks in an index.
Market capital is defined as the product of share price times the total
number of outstanding shares. This
weighting by market capitalization can cause price changes for a few stocks in
an index to disproportionally impact the overall index value. The S&P 500 index is a market
capitalization weighted index.
There are other types of weighting schemes for indexes. For example, the DOW Industrial Average index
weights each stock component by its price instead of its market capitalization.
An Overview of Selected Data for this Post
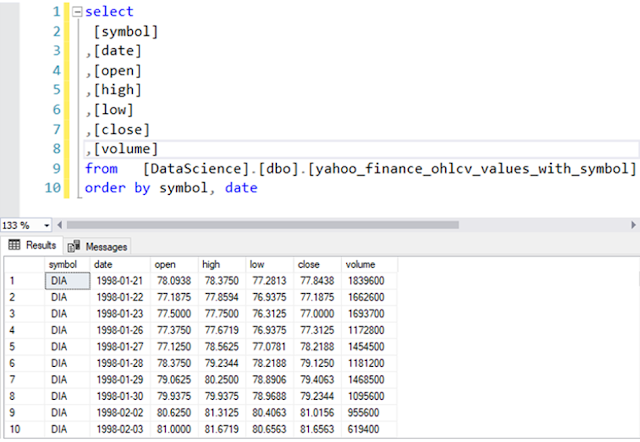
The following screenshot shows an excerpt from SQL Server
Management Studio. The top panel
contains a T-SQL script. The bottom
panel displays the first ten rows of the results set from script in the top
panel. The yahoo_finance_ohlcv_values_with_symbol
table is populated with historical price and volume data from the Yahoo Finance site for the ten
tickers tracked in this post.
The order by clause in the script sorts the results set rows
by trading dates within ticker symbols.
The displayed results are for the DIA ETF, and the launch date for the
DIA ticker symbol is 1998-01-21.
The next screenshot displays the last rows in the results set from the preceding script. As you can see, these rows are all for the UDOW ETF. The column to the left of the symbol column contains the row number. The last row in the results set has a date of 2023-12-29.

The last screenshot of this section displays some overall summary
data for each of the ten tickers tracked in this post.
- The first three columns are for the ticker symbol, the begin date, and the end date for each ETF.
o
The end date, 2023-12-29, is the same for all
ten tickers. This date is the final date
through which historical data are collected.
o
The begin date can vary by ticker. This is because the begin date reflects the
first trading date for which Yahoo Finance has historical trading data for a
ticker symbol.
- The last two columns reflect the total count of trading days from the begin date through the end date for each ticker as well as the fractional number to trading years for each ticker.
o
The count of trading days for each ticker is
merely the count of rows in the yahoo_finance_ohlcv_values_with_symbol table grouped
by ticker symbol.
o
According to Wikipedia,
there are an average of 252 trading days per calendar year. Therefore, the Fractional Trading Years column
values are the count of trading days for each ticker divided by 252.

The Comparison of ETF Tickers for All Tracked Trading Days
This post section shows the outcome of computing two metrics
to assess if leveraged ETFs can safely grow long-term investments more than unleveraged
ETFs. The results reported in this section
are for all trading days from the begin date through the end date for all five
pairs of tickers. These tickers are
specifically for ETFs based on market indexes, such as the S&P 500 index. The results may not apply to other ETFs that
track commodities, bonds, or single-stock ETFs (such as FBL or GGLL).
The first metric is the overall percent change of the close
price. You can compute this metric as
the close price on the end date less the close price on the begin date divided
by the close price on the begin date. If
this change percent is positive for a leveraged ETF, then the ETF can grow a
long-term investment safely. Otherwise,
the leveraged ETF does not grow long-term investment safely.
The second metric is the cagr, which assesses the average
percentage change on an annual basis from a begin date through an end date. The computational steps for computing this
metric are described and demonstrated in a prior
post. The code for the current post illustrates
how to perform the calculation in SQL Server with T-SQL code instead of with an
Excel spreadsheet.
Both metrics for each ticker symbol are computed from a
begin date through an end date designated, respectively, in the second and
third columns. The begin date is the first
trading date for which Yahoo Finance has historical price data for a ticker. The end date is the last trading date in 2023. Therefore, the metrics are computed over the
full lifetime of each ticker through the end of 2023.
Here’s a results set generated from a T-SQL script that computes
the comparison metrics for each ETF ticker.
The three most important columns are the first, next to last, and last
columns from the results set below.
·
The first column with a heading of symbol displays
the tickers for the ETFs tracked in this post.
·
The next to the last column has a header of
cagr. The more positive the value in
this column, the greater the average annual growth rate from the begin date
through the end date.
·
The last column has a column header of overall_percent_change. If the row value in this column is positive,
then the symbol for the ETF in the first column safely grows the capital invested
in it.

While the results set has all the information for comparing the
unleveraged versus the leveraged ETFs, it is not arranged in a format that
makes it easy to compare the two types of ETFs in terms of the comparison
metrics. Therefore, the results are
copied from the Results tab in SQL Server Management Studio to an Excel spreadsheet
that appears below.
Both the unleveraged and leveraged ETFs have positive overall percent change values, but the leveraged percent change values are substantially higher. The overall percent change values range from several hundred to more than eleven thousand. These values are quite large, but they describe change over a range of trading dates from about 14 years through about 30 years depending on when trade data became initially available for a ticker. It is also true that the cagr values for the leveraged ETFs are greater than for the unleveraged ETFs. Additionally, the leveraged cagr values exceed the unleveraged cagr values by a greater factor than is the case for the overall percent change metric. The cagr values for leveraged ETFs are generally about 3 to 4 times greater than the cagr values for unleveraged ETFs. Also, the leveraged ETF cagr values substantially exceed the cagr value for the SPY ticker, which denotes an unleveraged ETF. Because the cagr for the SPY ETF serves as a common benchmark for good market performance, this outcome confirms that a simple buy-and-hold strategy for leveraged market-based ETFs yield outstanding performance over the last 14 to 30 years.
|
For All Years |
||||||
|
Ticker |
Unleveraged |
Ticker |
Leveraged |
|||
|
CAGR |
Overall Percent Change |
CAGR |
Overall Percent Change |
|||
|
DIA |
6.28 |
384.14 |
UDOW |
25.19 |
2155.59 |
|
|
SPY |
7.99 |
974.15 |
SPXL |
24.89 |
2788.61 |
|
|
QQQ |
8.75 |
698.09 |
TQQQ |
40.94 |
11573.96 |
|
|
SOXX |
9.97 |
741.76 |
SOXL |
32.56 |
4774.26 |
|
|
IWM |
6.32 |
323.38 |
TNA |
15.00 |
724.45 |
|
The Comparison of ETF Tickers Over Two Successive Five-year Timeframes
Recall that the cagr computes compound annual growth rate
over a timeframe – from a begin date through an end date. Therefore, if the timeframe changes, you
would expect the cagr values to change.
The following display shows cagr values and overall percent
change for two different timeframes.
· The top table shows results for
the last five years of available trading data.
This is the timeframe from the first trading date in 2019 through the
last trading date in 2023.
· The bottom table shows results for the next to the last five years of available data. This is the timeframe from the first trading date in 2014 through the last trading date in 2018. These two timeframes have identical durations, but they extend over different date ranges. Therefore, the results by ticker are more comparable than the results for all years because each ticker in the preceding table can occur over a different timeframe.
Except for the IWM ticker which is based on the Russell 2000
index, the leveraged ETFs have consistently positive and larger overall growth
than for the unleveraged ETFs. In addition,
for the last 5 years table, the TNA ticker, which is for a leveraged ETF,
returned a negative cagr value while the IWM ticker, which is for a comparable
unleveraged ETF, returned a positive cagr value. In other words, leverage hurts the growth
rate for the TNA ETF in comparison to its matching unleveraged ETF (IWM).
While the remaining four pairs of ETFs (DIA and UDOW, SPY
and SPXL, QQQ and TQQQ, SOXX and SOXL) have a consistent trend of leveraged
ETFs returning superior cagr values, the cagr values are not identical for all
years versus either of the two fixed-duration timeframes. This implies, perhaps unsurprisingly, that growth
rates vary across timeframes even if there is a consistent tendency for
leveraged ETFs to return higher cagr values than for unleveraged ETFs.
Finally, it is worth mentioning that in both the last 5 year timeframe and next to the last 5 year timeframe, the leveraged ETFs returned consistently superior cagr values to the SPY. Because the SPY is a widely referenced security investment benchmark, these results indicate it may be possible to use leveraged ETFs as part of a strategy to generate substantially superior growth than the industry benchmark from the SPY ticker.
|
For Last 5 Years |
||||||
|
Ticker |
Unleveraged |
Ticker |
Leveraged |
|||
|
CAGR |
Overall Percent Change |
CAGR |
Overall Percent Change |
|||
|
DIA |
10.08 |
61.50 |
UDOW |
15.81 |
108.06 |
|
|
SPY |
13.73 |
89.99 |
SPXL |
25.92 |
215.79 |
|
|
QQQ |
21.51 |
164.41 |
TQQQ |
40.20 |
439.79 |
|
|
SOXX |
29.61 |
264.80 |
SOXL |
40.76 |
450.68 |
|
|
IWM |
8.33 |
29.05 |
TNA |
-1.63 |
-7.87 |
|
For Next-to-last 5 Years | ||||||
Ticker | Unleveraged | Ticker | Leveraged | |||
CAGR | Overall Percent Change | CAGR | Overall Percent Change | |||
DIA | 7.30 | 42.10 | UDOW | 20.98 | 158.72 | |
SPY | 6.45 | 36.63 | SPXL | 16.26 | 112.12 | |
QQQ | 12.09 | 76.76 | TQQQ | 29.74 | 266.70 | |
SOXX | 16.99 | 118.81 | SOXL | 38.37 | 405.57 | |
IWM | 3.26 | 17.34 | TNA | 2.38 | 12.43 | |
Summary
I hope you find these results of interest. For self-directed traders who manage their
own long-term investments, these analyses suggest an easy way (buy and hold) of
managing long-term investments --
presuming the market always goes up in the long run. For professional security advisors, these outcomes
offer, except for those based on the Russell 2000 index, historical guideposts
for beating industry benchmarks by substantial margins.
If you would like the programming files referenced in this
tip, please send a request to RickDobsonBlogs@gmail.com. These files do not include the historical
data because they belong to Yahoo Finance.
However, you can download historical data from Yahoo Finance for your
own custom analyses without charge. A
future post will provide readers of the Security Trading Analytics blog
detailed examples of how to download historical price and volume data from
Yahoo Finance.
I just recently started to blog, and I welcome your
suggestions about how to improve posts for you and the best ways to send files
from future posts to you. Thank you very much for any feedback that you
send to me.


Comments
Post a Comment