How to Download and Display Historical
Price and Volume Data
Data are the lifeblood of analytics, and this post aims to
give you an introduction to downloading historical price and volume data from
Yahoo Finance. Google’s Gemini app claims that the Yahoo Finance site attracts as many as 100 million visitors per
month. Some reasons for this degree of
popularity may be because the site offers free news videos, price quotes, and
historical data. It also offers a
premium line of services in addition to its free services. After you collect historical data, you can
analyze the data by transferring them to your favorite analytics package. This post includes simple demonstrations for
how to transfer historical data downloaded from Yahoo Finance to three
different popular analytics packages (i.e., Excel, SQL Server, and Python).
What kind of historical data will you learn to download?
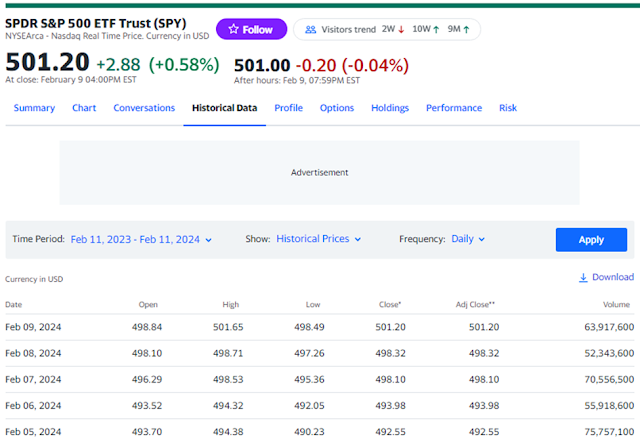
The following screenshot shows an example of the type of historical data that this post illustrates how to download. The data are for the SPY ticker, which tracks the S&P 500 index. The ticker symbol appears towards the top of the screenshot. Five days of data are excerpted from a browser view of the Yahoo Finance site. The daily dates appear in the leftmost column. Beyond the dates, there are six data columns for different types of prices and one column for the volume of shares exchanged on a trading date.
o
Close prices show the raw security prices adjusted
for splits at the end of a trading day. It
is common for stock market technical analysts to use close prices when tracking
price trends.
o
Adj close prices update raw security prices for
splits, dividends, and other capital adjustments. Adj close prices are typically used by
fundamental analysts when tracking long-term security price trends as well as
for fundamental analysis.
o
The open prices indicate prices at the beginning
of a trading day.
o
The high and low prices denote the high and low
prices during a trading day.
o
The volume column contains integer values
revealing the number of shares exchanged during a trading day.
Downloading historical data to a csv file
Yahoo Finance makes it relatively easy to download
historical data to a browser session. The
following screenshot excerpts the top of the Yahoo Finance home page with SPY
entered into the search box towards the top of the page. Clicking the magnifying glass icon can open a
screen like the preceding one. The
preceding screenshot was taken during the weekend following February 9, 2024,
which was the last trading day in a week.
Next, clicking the Historical Data link reconfigures the page menu items
and tools for downloading some specified data to the download folder on a
Windows computer running the browser session.
An excerpted version of this page appears above.

The following pair of screenshot excerpts show historical data
for SPY beginning on January 2, 2024 and running through February 9, 2024. Notice that the Time Period setting is from
Jan 01, 2024 through Feb 10, 2024. The
beginning and end dates are automatically excluded from the return dates because
Jan 01, 2024 is a stock market holiday and Feb 10, 2024 is a weekend date
during which stock markets do not operate.
The default setting for the Show field is Historical Prices. You can also alternatively select Dividends Only,
Stock Splits, or Capital Gain. For the
Frequency field, you can select the return of daily, weekly, or monthly data.
For your historical data settings to be shown in the browser
window, you must click the Apply button.
After choosing to apply your historical data settings, you can click the
Download link. This action will place
the designated historical data in the download folder of the user running the
browser session.


Here is an image from a Notepad++ session of the csv file
sent by Yahoo Finance to your computer’s download folder. The image for the csv file is formatted
slightly differently than the browser session image. For example, the rows appear in ascending instead
of descending date order starting at 2024-01-02 and running through 2024-02-09.
Another issue to note is that the csv file is not the
correct Microsoft format for a csv file.
For example, data rows end with a linefeed (LF), but the rows have no
carriage return (CR). This impacts how
the data are imported into SQL Server, but it does not impact how the csv file
data are imported into either Excel or Python.

Downloading the historical data to an Excel file
The Notepad++ example above imports the SPY (13).csv file with string content. In other words, the dates, prices, and volume fields are string values (you can’t do arithmetic with the prices or invoke date functions for the date values). In contrast, Excel allows you to open the SPY (13).csv file with the values automatically typed so you can perform numerical analysis.
To open the file in Excel, initiate an Excel session. Click the file folder icon on the session’s first page to open a folder, then click Browse. Next, select All Files (*.*) on the Open dialog. Then, click the Downloads folder under This PC. Within the Downloads folder, select the file that you want to import into Excel. Finally, click the Open button in the Open dialog.
Here is a sample final screen image just before clicking the Open
button.

After clicking the Open button, the csv file is imported into an Excel worksheet with string fields transformed to Excel data types. Here is an image of the transformed csv file in Excel. Notice that each field appears in a separate Excel worksheet column. Because Notepad++ is a text processor field values do not appear in columns. Instead, they are separated by commas on a row, and the end of a row is marked by an LF character. The values in the Excel worksheet columns match those of the comma-separated values shown in the Notepad++ session.

Downloading the historical data to a SQL Server table
The SPY (13).csv file can also be downloaded to a table in
SQL Server. Transferring and displaying the
file data can start with creating a SQL Server table having the appropriate column
data types for storing the csv file data.
You then need to read the file data into the table. Finally, you can display the transferred data
in SQL Server Management Studio with a select statement. This section shows you the code for
implementing the preceding steps.
SQL Server offers its own custom version of SQL called Transact
SQL (or T-SQL). The following script
illustrates the T-SQL code for downloading and displaying data from Yahoo
Finance.
- The script starts with a use statement for the SecurityTradingAnalytics database. This database was manually created with the New Database command in SQL Server’s Object Explorer. A database in SQL Server acts as a container for a collection of objects in a SQL Server instance.
- Next, the code creates a fresh version of the PriceAndVolumeDataFromYahooFinance table in the dbo schema of the SecurityTradingAnalytics database. There are two steps to creating a fresh version of a table in SQL Server.
- First, drop any prior version of the table. The following code sample conditionally drops the table if it exists already.
- Second, use a create table statement to initiate an empty version of the table.
- Within the create table statement, you can name and specify key properties for table columns. Within the PriceAndVolumeDataFromYahooFinance table, there are three types of columns. The settings for all three types of columns specify that null values are not allowed.
- The date column is a table field that holds the year, month, and date for a row of data.
- The [open], high, low, [close], and adjclose columns are for storing price data. As a result, the script uses a decimal data type for designating the data type of the values in these columns. The open and close columns appear in brackets because these columns are named with SQL Server reserved words.
- The Volume column contains discrete values, which in some cases can be larger than the maximum SQL Server integer data type value. Therefore, this column is assigned a bigint data type, which can be as large as 9223372036854775807.
- The bulk insert statement transfers data from the SPY (13).csv file to the PriceAndVolumeDataFromYahooFinance table. The parameters for this statement indicate
- The data starts in the second file row (after a row of column headers)
- The delimiters between fields on a row in the file are commas
- Each row of data in the file ends with a linefeed character rather than a linefeed character followed by a carriage return character.
- The select statement at the end of the script displays the values transferred from the csv file to the PriceAndVolumeDataFromYahooFinance table.
The following screen excerpt shows the output from the
select statement in the preceding script.
As you can see, this output is identical to the original csv file
downloaded by Yahoo Finance. However, the
values now reside in a SQL Server table and can be manipulated programmatically
in all the ways that SQL Server allows.
For example, you can compute moving averages as well as other technical
analysis indicators for the underlying values.
Furthermore, you can build custom models that indicate when to buy and
sell securities or perform non-standard data analyses for the downloaded data.

Downloading the historical data to a pandas dataframe in Python
The pandas library for Python is specifically designed to
store and process tabular data in a pandas dataframe object. Python stores the dataframe object in memory
whereas SQL Server often stores tabular data on disks. Python also has a rich collection of libraries
that may simplify the implementation of advanced statistical and data science
analysis techniques.
The following script shows how to read and display the contents of the SPY (13).csv file with the pandas library.
- It begins by importing the pandas library into a Python session.
- Next, the pandas options.display.width setting is assigned a value of 0. This step is often helpful to avoid columns wrapping into two separate table sections when they are displayed.
- The pandas read.csv method reads the SPY (13).csv file into a dataframe named df.
- The Python print method displays the df dataframe on the default output device.
Here is the printed output in the IDLE output device
window. IDLE is an integrated
development environment that ships with the Python package when you download it
from the Python.org site. Notice the
values match those displayed from Excel and SQL Server.

Summary
I hope you find the demonstrations in this post helpful in
automating the gathering of data for your own custom security analyses. My prior securities analyses confirm Yahoo
Finance provides high quality securities data.
This tip includes examples of how to access securities data for custom
analyses that can be performed with Excel, SQL Server, and Python.
A pair of prior posts on this blog gathered data from Yahoo
Finance for custom analyses. An earlier
post titled “Can
Leveraged ETFs Safely Grow Long-Term Investments?” illustrates how to
compare the effect of leverage for ETFs based on market indexes. This analysis was implemented with T-SQL code
in SQL Server. Another prior post titled
“How
to Compare Close Prices for Three Securities Over Four Years” presented a
general framework for comparing alternative securities with Excel and the
compound annual growth rate.
I hope this post and the two earlier posts equip you to perform your own custom analyses that advance securities trading analytics.


Comments
Post a Comment