Historical Price Use Cases for the GoogleFinance Function in Google Sheets
In the quest to develop smarter, more reliable trading strategies tailored to individual preferences, historical price data plays a vital role. It helps analysts, developers, and self-directed traders fine-tune algorithms, validate models, and uncover patterns that might otherwise go unnoticed. But despite its significant benefits, acquiring and processing high-quality historical data often requires substantial investments in time, money, or both.
As a security price data analyst and quantitative analysis trainer, I gravitate toward rich historical data sources that are both free and easy to use. This is because I want readers like you to be able to try out the analyses and models discussed in my articles. For years — including the early days of this blog — I relied heavily on free historical data from Yahoo Finance. That changed abruptly when Yahoo Finance discontinued free access to its data.
In response, I began exploring alternative historical price data sources that are accessible and suitable for custom analyses. One of the first options that caught my attention was the GOOGLEFINANCE function in Google Sheets.
This post revisits three earlier blog entries that demonstrate use cases for leveraging the GOOGLEFINANCE function in trading analytics. If you have a Google Mail account (which is free), you already have access to Google Sheets and can follow along easily. My hope is that you’ll bookmark this post as a handy reference whenever you — or a colleague — need historical price data to test a trading idea.
We also plan to continue reviewing other free historical data sources, and I invite you to leave a comment with suggestions you'd like us to explore.
Gathering and Exporting Historical Stock Price Data
This blog’s first post about the GOOGLEFINANCE function is titled “GOOLEFINANCE Function in Google Sheets Can Download Historical Data via CSV Files”. As the title implies the main objective of the post is to empower readers with how to collect data on a Google Sheet workbook and export historical stock prices from a Google Sheet workbook. The GOOGLEFINANCE function extracts data from the Google Finance site instead of the Yahoo Finance site.
The post assumes readers are new to the GOOGLEFINANCE function. It opens with a demonstration on how to retrieve near-real-time stock data (with a slight delay). Typically, the function requires a ticker symbol followed by an attribute name. For example, you might use tickers like GOOGL or MSFT with attributes such as price, low, or high, covering the most recent values available in a trading day. The function also supports selected fundamentals, such as pe (price-to-earnings ratio) and eps (earnings per share).
When using GOOGLEFINANCE for historical data, you’ll need to specify a start date, an end date, and an interval; preset interval selection options include either daily or weekly. You can pull up to five attributes: open, high, low, close, and volume. Alternatively, use "all" to return the full set of historical data within your designated range. The post also includes syntax examples for specifying date ranges and attributes.
It’s sometimes useful to include the exchange name when defining a ticker — especially if a ticker string appears on multiple exchanges, which is common. Typical exchanges include NASDAQ, NYSE, and NYSEARCA. In certain cases, the same ticker string may refer to different securities depending on the exchange. This post helps readers navigate this potentially detailed but important aspect of historical data retrieval with the GOOGLEFINANCE function.
The post wraps up with examples of exporting historical data in a csv file format — ideal for analysis in other tools like Python or SQL Server. In addition to exporting a csv file, you can also share downloaded data on a website. You can learn more about the website option of sharing data by prompting Gemini 2.5 Flash with: “How and why would I want to post historical data from Google Sheets to a website for referencing by others?” If you do choose to share data from a website, I recommend creating a backup copy to safeguard against loss or unintended edits from site visitors.
Comparing Analytical Findings Across Google Finance and Yahoo Finance
This blog’s second prior post about the GOOGLEFINANCE function is titled “Do Returns from the GOOGLEFINANCE Function In Google Sheets Match Returns from Yahoo Finance?”. The objective of this second post is to take a prior analysis based on data from Yahoo Finance and verify if the same findings could be obtained for comparable analyses for data from the GOOGLEFINANCE function in Google Sheets.
The prior analysis is described in a post titled “Can Leveraged ETFs Safely Grow Long-Term Investments?”. This post contrasts the returns from leveraged ETFs versus matching unleveraged ETFs. The leveraged ETF tickers are: UDOW, SPXL, TQQQ, SOXL, and TNA. The corresponding unleveraged tickers (without exchange prefixes) are: DIA, SPY, QQQ, SOXX, AND IWM.
Comparisons across the two posts were performed over slightly different timeframes. The preceding posts process data from Yahoo Finance and the GOOGLEFINANCE function, respectively, for the five years before the date of each analysis. Recall that the GOOGLEFINANCE function was not used on a regular basis until Yahoo Finance stopped enabling free downloads for csv files with historical price data.
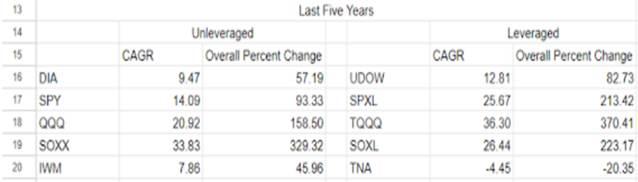
The historical date range from Yahoo Finance was from the first trading date in 2019 through the last trading date in 2023. Here are the results with two metrics for price growth over the five years.
· One metric is CAGR for the compound annual growth rate. This metric is for the average annual growth rate compounded yearly over the five years in the analysis.
· The other metric is the Overall Percent Change from the first trading day through the last trading day across the five years in the analysis.
· Across four market ticker pairs (DIA-UDOW, SPY-SPXL, QQQ-TQQQ, and SOXX-SOXL), the leveraged ETFs returned consistently larger CAGR values. All four of these ticker pairs had a larger Overall Percent Change value for the leveraged ticker as opposed to the matching unleveraged ticker.
· On the other hand, the IWM-TNA ticker pair returned a lower CAGR value for the leveraged ticker (TNA) than for unleveraged ticker (IWM). For this ticker pair, the Overall Percent Change value was negative for the leveraged ticker, but the Overall Percent Change value was positive for the unleveraged ticker.
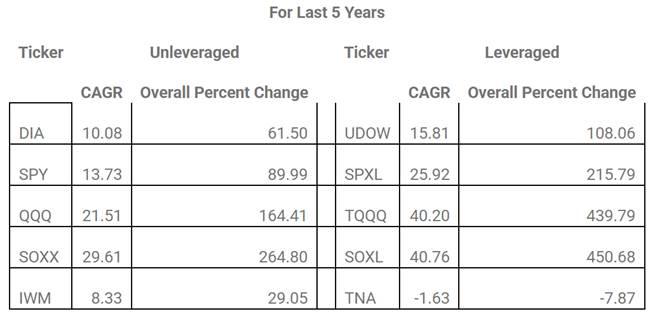
The historical date range for the data from the GOOGLEFINANCE function was from September 30, 2019, through September 30, 2024. Here are the results with the same two metrics reported in the preceding table.
· Three leveraged ETFs (UDOW, SPXL, and TQQQ) have consistently larger CAGR values than for the matching unleveraged ETFs (DIA, SPY, and QQQ). The Overall Percent Change values are also consistently greater for these leveraged ETFs than for the unleveraged ETFs.
· In contrast, two ETF pairs (SOXX-SOXL and IWM-TNA ) returned lower CAGR values for the leveraged tickers (SOXL and TNA) than the unleveraged tickers (SOXX and IWM). This is because the Overall Percent Change is less for these two leveraged tickers than for the two unleveraged tickers.
Across all five pairs of tickers, the CAGR values are always larger whenever the Overall Percent Change values are larger. This outcome is consistent whether the data are from Yahoo Finance or the GOOGLEFINANCE function.
Analyzing the Tickers in a Watchlist
This blog’s third prior post on the GOOGLEFINANCE function is titled “Assessing Returns for Stocks In Watchlists”. The prior post gives an example of constructing and tracking a collection of watchlists with leading securities in several different categories. The watchlists are compiled based on data collected for the weeks during 2024 ending on January 5, 2024 through December 20,2024. It is my hope that you find the criteria and steps used for evaluating watchlist items in this post helpful when you are constructing your own watchlists that reflect your personal investment style.
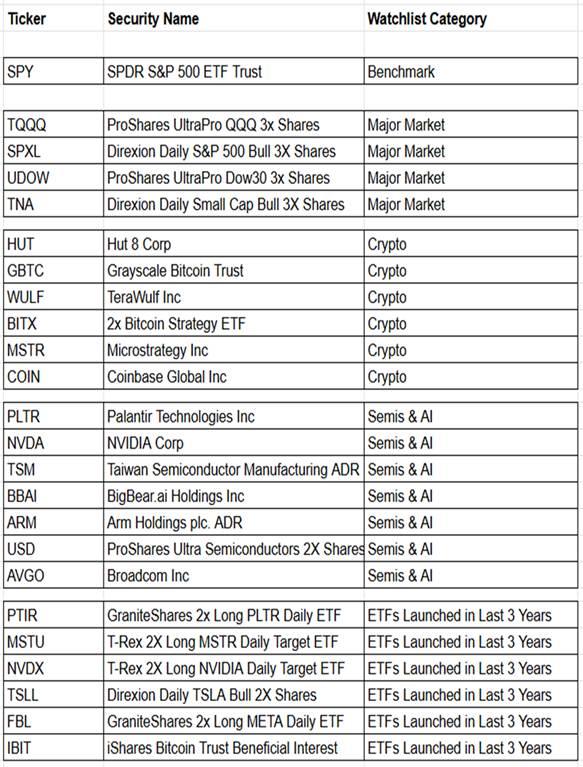
The following table itemizes the four watchlists along with the SPY benchmark ticker tracked during 2024. As you can see, there are three columns in the table: one for the ticker name of each security item, another for the security name of each item, and a final column for the role (either as a benchmark or a watchlist category member) of the item in the table. There are 24 tickers in the table. The ticker in the first row (SPY) serves as a benchmark to help evaluate the other 23 tickers. The four watchlist category names are: Major Market, Crypto, Semis & AI, and ETFs Launched in Last 3 Years.
There are three metrics for evaluating the performance of tickers: average price change percent, standard deviation price change percent, and average price change percent divided by standard deviation change percent. Change percent refers to the change in close price for the current week divided by the close price for the previous week less one.
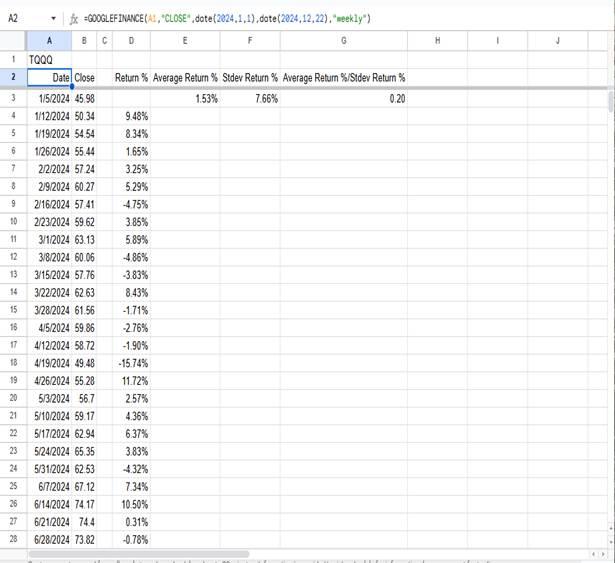
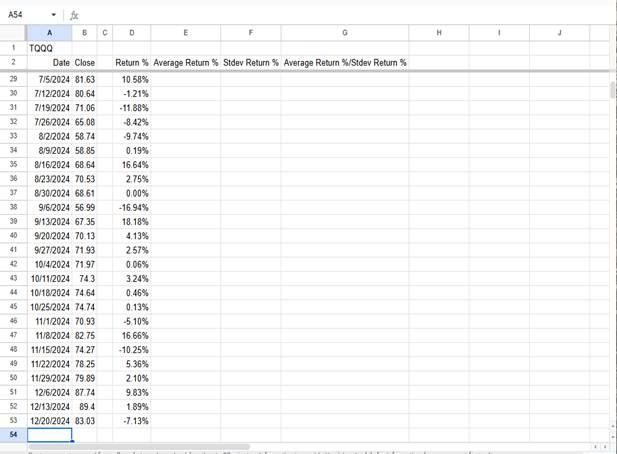
The next two screenshots show the top and bottom segments of a Google Sheets worksheet for the TQQQ ticker. The worksheet below spread across two different screenshots displays weekly ending dates for 2024 trading weeks in column A and close values for the end of each week in column B.
· The cursor for the top screenshot rests in cell A2, which contains a GOOGLEFINANCE function expression that extracts the week-ending dates and close values in columns A and B, respectively.
· The GOOGLEFINANCE function parameters
o Start with a reference to cell A1 that contains the string value for a ticker (TQQQ)
o The “CLOSE” string value as the second parameter names the historical price attribute to download from the Google Finance site to the current Google Sheets worksheet
o The two date functions for the third and fourth parameters designate the earliest start and the latest end dates for weekly historical close price values
Mondays are for the first calendar day of a trading week with the GOOGLEFINANCE function, but Monday, January 1, 2024, is a trading holiday so the first full trading week of January, 2024 includes January 2, 3, 4, and 5. Notice that the first weekly date in the first screenshot below contains January 5, 2024.
Sundays are the last calendar day of a trading week with the GOOGLEFINANCE function. Therefore Sunday, December 22, 2024 is the last calendar day in the last trading week tracked by the GOOGLEFINANCE function, and the trading days in that week are December 16, 17, 18, 19, and 20 in 2024. Notice that the last weekly date in the second screenshot below ends on December 20, 2024.
Cells D4 through D53 contain expressions that compute the return percent from the close value for the preceding week. Therefore, the value in cell D4 indicates that the close value for the week ending January 12, 2024, is 9.48 percent larger than the close value for the week ending on January 5, 2024.
The return percent values in column D form the basis for the three metrics that evaluate the performance of each ticker in the preceding table during 2024. The expressions in cells E3, F3, and G3 compute the metrics for tracking the performance of the ticker string value in cell A2.
· The expression in cell E3 computes the average percent return for the return percent values in column D. The code for the expression is =AVERAGE(D4:D53).
· The expression in cell F3 computes the standard deviation for the return percent values in column D. The code for the expression is =STDEV(D4:D53).
· The expression in cell G3 computes the average percent return values in column D relative to the standard deviation of the return percent values in column D. The code for the expression is =E3/F3.
· As the expression’s code in cell G3 indicates this metric reflects the average percent return adjusted by the standard deviation return percent. When the average percent return is larger than the standard deviation return percent, then a ticker returns value is above and beyond its normal variation.
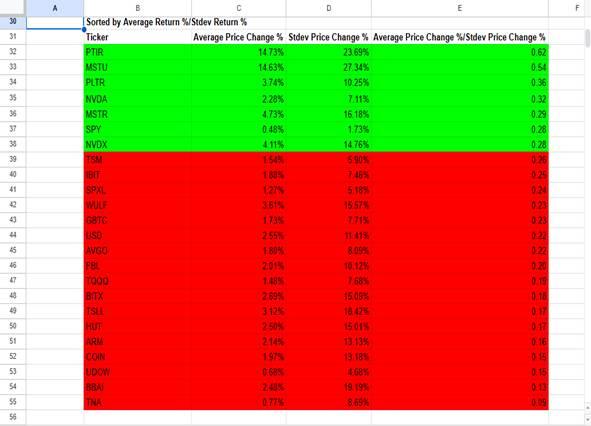
The worksheet pictured above in two screenshots is from a Google Sheets workbook that contains a separate worksheet for each of the tickers in the preceding table. The worksheet section pictured below shows each of the three metrics for each ticker tracked in the post.
· The rows are sorted by the average price change percent divided by the standard deviation price change percent for each ticker. These values appear in column E.
· The rows for tickers with a metric value in column E greater than or equal to the metric value for the SPY ticker are colored green. The other rows are colored red.
The SPY ticker has an average percent change (.48%) that is lower than any other ticker reported on in the following table. However, the SPY ticker also has a standard deviation change percent lower than any other ticker.
Consequently, the SPY ticker has a column E metric value with a very low standard deviation price change value versus its average price change percent.
Tickers from rows with column E metric values that are greater than or equal to the SPY ticker column E metric value have exceptional price percentage change values on average.
o Tickers from rows with column E metric values that are less than the SPY ticker column E metric value have unexceptional price percentage change values on average.
Concluding Comments
This post is designed to briefly describe three examples of how to use the GOOGLEFINANCE function to track the performance of tickers in a Google Sheets worksheet or a workbook. I urge you to consider using this function when you need to track or compare historical price data for security tickers. It is an easy way and free way to collect historical price values for an analysis.
If you already use Google Sheets it will be particularly straightforward to collect historical price values with the GOOGLEFINANCE function. Even if you do not currently use Google Sheets, the capability of the GOOGLEFINANCE function to deliver free historical data for security tickers may make it worth the effort to become familiar with Google Sheets and its GOOGLEFINANCE function. The referenced blog posts within this post were selected to simplify becoming familiar with Google Sheets and/or its GOOGLEFINANCE function.


Comments
Post a Comment